 The entrance faces SE.
6-sensor Temperature Monitor for Bee Hives
Based on a Ceech board which emulates Arduino Pro Mini
Acknowledgements
Thanks due to Jody Noury for putting this kit together and for supplying the code for the multigraph viaualisation of the data. Thanks also to Clive and Glyn Hudson for their hive monitoring project which provoked me to try doing one myself.
Related projects
Glyn, Clive & Shân Hudson's National hive monitor: www.beemonitor.org
Jody Noury's Warré hive monitor with time-lapse photos: www.jodaille.org & www.jodaille.org/snapshots/
Open Source Beehives: http://opensourcebeehives.net/
Arnia Remote Hive Monitoring: www.arnia.co.uk
Hive Tool: www.hivetool.org
Hive Eyes: https://community.hiveeyes.org/
Monitor technical details
The monitor is based on a Ceech Astri Arista board with a real time clock, micro SD card writer/reader, a 18650 4.2V battery, and six DS18B20 waterproof temperature sensors. Note that the Ceech Astri Arista boards that we received had the SDA/SCL contact labels the wrong way round. This was taken into consideration when connecting the real time clock.
A fuller account of the equipment is here.
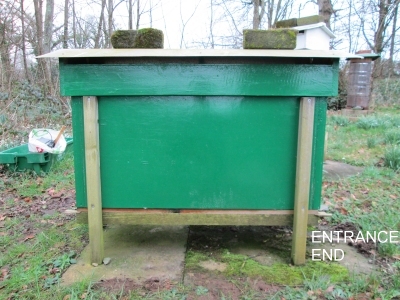
Monitoring temperatures in a modified Lazutin hive
This is a one-box trough or long hive with 460 mm deep foundationless frames on UK National hive top-bars. It has a Warré hive type top configuration comprising a hessian top-bar cloth, a 100 mm deep quilt filled with wood shavings in a wooden frame, and an aluminium curved roof with a vented air space under it, the eaves of the roof coming 25 mm below the joint between top-bar cloth and quilt. Full details and more pictures here.
The entrance faces SE.
Locating the cluster or brood nest to determing final sensor placement
The 6 sensors were arranged on the top-bar cloth at 140, 210, 280, 350, 420 & 490 mm from the front (entrance) outer wall of the hive. Ambient was about 8C. The monitor was switched on after replacing the quilt and roof.
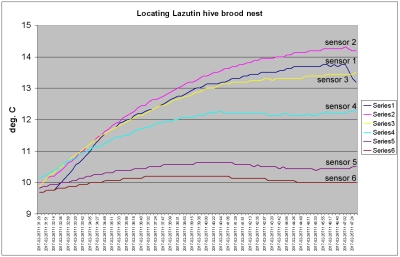
S2 was the warmest followed closely by 1 & 3. Therefore, the centre of the cluster was about 210 mm from the end. As the end wall is 38 mm thick and the frame spacing is 35 mm, cluster centre is therefore in the 5th inter-frame space from the front.
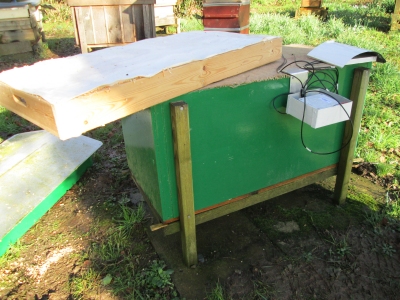
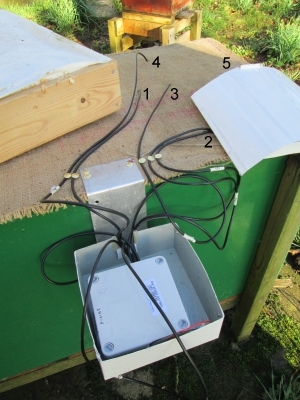
Installation
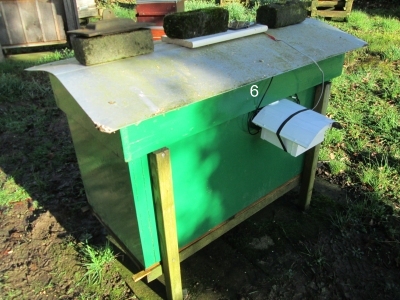
The monitor was installed in an aluminium housing on the SW (long) side of the hive. The sensors were pushed to various depths through holes in the top-bar cloth. Sensor 6 (ambient) was in the ventilated roof cavity on the NE side; sensor 5 against the entrance end follower board by the first comb, 70 mm deep; sensor 4 against the NE wall 70 mm deep; sensor 3 in the middle of the warmest part of the cluster, 210 mm back from the outer rim of the entrance wall and 150 mm deep; sensor 2 against the SW wall, 70 mm deep; sensor 1 two seams towards the back from sensor 3, 150 mm deep.
A 3 mm deep notch was cut in the rim of the quilt to accommodate the monitor mounting and wires. The solar panel was mounted on a board resting on the roof and weighted with a brick.
Multigraph visualisation of
modified Lazutin hive temperature data at dhmonitor.jodaille.org
(using emoncms.org powered by openenergymonitor.org)
NB. Frames are numbered from the front of the hive by the entrance (to the right in the above photos).
Hover mouse pointer over chart for navigation buttons to appear
top right. The data are uploaded weekly so it may be necessary to use the back arrow to
show the end of the temperature traces. NB. Times are Greenwich Mean
Time (GMT) throughout.
Sensor key
1 central between frames 7 & 8, 150 mm deep
2 against SW wall by frames 5 & 6, 70 mm deep
3 cental between frames 5 & 6, 150 mm deep
4 against NE wall by frames 5 & 6, 70 mm deep
5 against front wall, 70 mm deep
6 ambient, in shade under eaves
Comments on the multigraph
Sensor 3 was placed in a brood seam identified
localised at the beginning of monitoring by the surface temperature of the top-bar cloth,
as described above. Sensor 1 was placed two seams from sensor 3, further away from the
entrance, i.e. between frames 7 & 8. Sensor 1 reached brood temperature by 25 March.
Sensors 3 and 4 record temperatures by the hive walls at the ends of the seam with
sensor 3, i.e. the seam between frames 5 & 6. Sensor 5 is in the seam between frames 1
& 2.
18 May 2017 The monitor stopped recording on 18 May and was removed for maintenance. The fault was traced to failure of the Ceech board due to corrosion of the power supply feed in the printed circuit, probably due to condensation or rain seepage. Unfortunately this coincided with two unusually hot days on 25 & 26 May with temperatures above 25C. The printed circuit was repaired and recording resumed on 29 May.
8 July 2017 Temperatures near the sensors between frames 5/6 and 7/8 began to depart from brood temperature suggesting that the brood area was shrinking.
25 July 2017 Seam 5/6 sensor retured to brood temperature.
13 August 2017 Seam 7/8 sensor returned to brood temperature.
8 September 2017 Inspection of the hive to assess winter stores, starting from the back and stopping at seam 7/8. The sensor in that seam was a little above the brood area and was moved down into the brood. The sudden rise in temperature at sensor 1 is clearly visible on the multigraph. The stores were estimated at a little under two frames worth but scattered in small amounts over 11 frames, mostly atthe top.
10 October 2017 Precautionary feed of 2 kg sugar syrup and honey in a tub at the back of the hive with the surface covered with wine corks.
The initial data were visualised using Microsoft Excel. The charts are archived here.
See also: 6-sensor temperature monitor of modified Warré hive here.
David Heaf
Email: david (at) dheaf (dot) plus (dot) com
David Heaf's beekeeping pages: www.bee-friendly.co.uk