6-sensor Temperature Monitor for Bee Hives (Technical details)
Based on a Ceech board which emulates the Arduino Pro Mini
Acknowledgement: thanks due to Jody Noury for putting this kit together.
Related projects:
Glyn, Clive & Shân Hudson's National hive monitor: www.beemonitor.org
Jody Noury's Warré hive monitor: www.jodaille.org
& www.jodaille.org/snapshots/
Open Source Beehives Fab Lab Barcelona: www.fablabbcn.org/0000/01/08/open-source-beehives.html
Arnia Remote Hive Monitoring: www.arnia.co.uk
Hive Tool: www.hivetool.org
Components
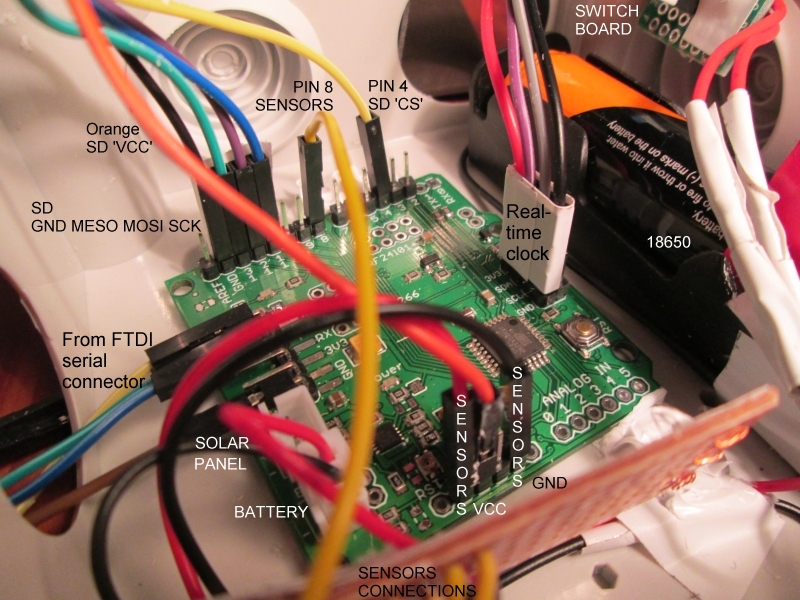
The monitor is based on a Ceech Astri Arista board with a real time clock, micro SD card writer/reader, a 18650 4.2V battery, and six DS18B20 waterproof temperature sensors. The Astri Arista emulates an Arduino Pro Mini (ATMega328, 3.3V, 8Mhz).
To save power, the power LEDs on both the Arduino and RTC boards were removed.
Ceech board's atmega328 programmed to save to card every 30 seconds. Sleeps the rest of the time.
Sketch: DavidHeafHivesMonitorV2.ino
Connection scheme
Note that this version uses the 3.3V voltage regulator on the Ceech board.
Sensors |
||||||
Astri Arista |
RT clock |
micro SD |
DS18B20 |
|||
VCC (3.3V bus) |
VCC |
+VE (red) |
||||
GND |
-VE bus |
GND |
-VE bus |
GND |
-VE bus |
-VE (black) |
| Vin (from battery 4.2V) | VCC* | |||||
SCL (A5)** |
SCL |
|||||
SDA (A4)** |
SDA |
|||||
8 |
4.7K pull-up resistor to +3.3V bus |
|||||
8 |
Signal (yellow) |
|||||
11 |
MOSI |
|||||
12 |
MISO |
|||||
13 |
SCK |
|||||
4 |
CS |
|||||
Power supply |
||||||
18650 cell +4.2V |
Switch (blue) |
+3.3V bus/net |
||||
Astri Arista |
FTDI serial adapter |
|||||
GND |
GND |
|||||
CTS |
not used | |||||
VCC |
VCC |
|||||
RX1 |
TX |
|||||
TX0 |
RX |
|||||
| RS | DTR | |||||
* Initially the micro SD card writer was connected to the
+3.3V bus, but this voltage was found insufficient to run it due to the SD card writer's
built in voltage regulator which further reduced the voltage below 3.3V.
** It was brought to our attention by the producer of the Ceech Astri Arisa board that
some of the boards had the SCL/SDA connectors wrongly labelled. This was the case with
both the boards that we obtained in that 'SDA' should have been marked 'SCL', and 'SCL'
should have been marked 'SDA'. This was taken into account when connecting the real time
clock.
Teething troubles
The monitor was shipped by post and did not save a file to the SD card on arrival, except when the Ceech Astri Arisa board was connected to a PC through the FTDI serial adapter. The problem appeared to be too low a voltage to the SD card reader/writer, i.e. only 2.4V, although VCC was 3.3V, taken from a 3V3 pin on the Ceech board.
The solution was to supply power separately from the battery direct to the SD's VCC pin by connecting to Vin on the Astri Arista, i.e. 4.2V when the battery was fully charged.
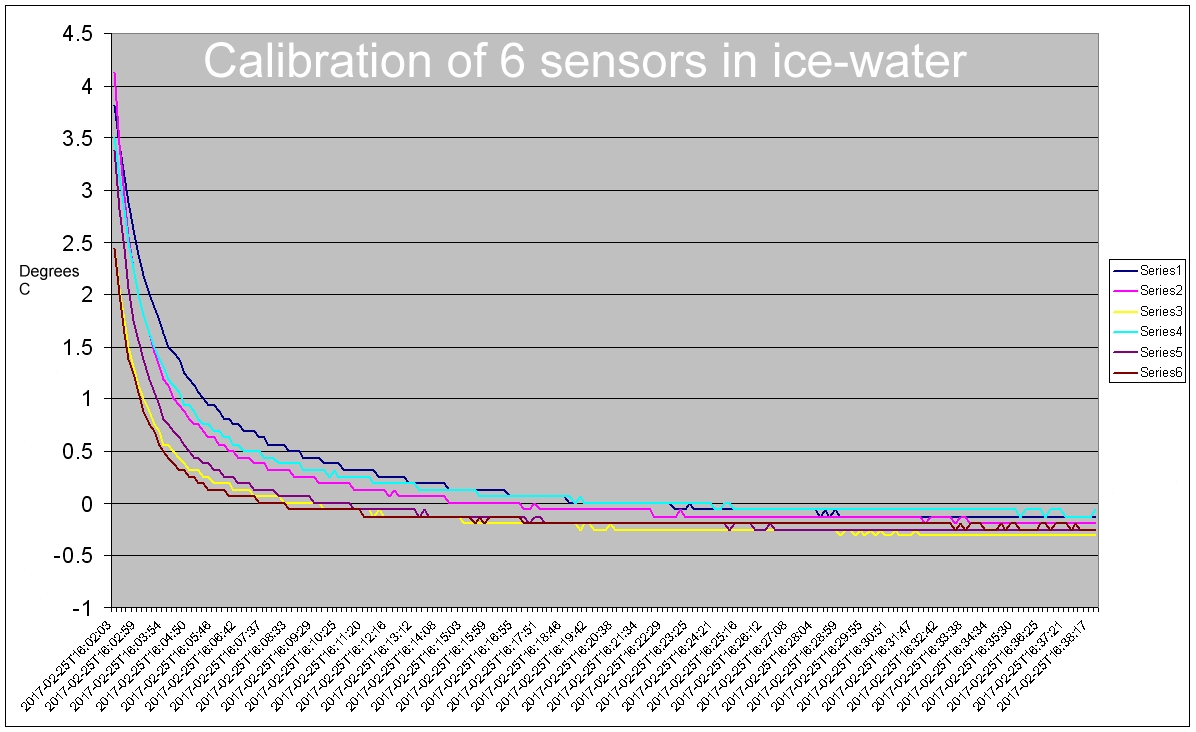
Sensor Calibration
Although the DS18B20 sensor specification says 'accuracy over the range of -10°C to +85°C: ±0.5°C' it seemed advisable to check them in the range of temperatures likely to be encountered, e.g. 0-40°C. The low temperature was checked by putting the sensors bound together with a rubber band in melting ice. Once the readings had stabilised the six sensors average readings over ten minutes were -0.13 -0.16 -0.30 -0.07 -0.25 & -0.21°C with an average for all of -0.19°C, i.e. well within specification.
For the calibration at 40°C the sensors were placed in warm water in a well insulated container. They were again bound together and a clinical mercury-in-glass thermometer affixed to them. This thermometer recorded the maximum reading when the sensor temperatures recorded a plateau which lasted 2 minutes. Their average readings over that period were 38.21, 38.31, 38.13, 38.30, 38.31 & 38.31°C with an overall average of 38.26°C. The clinical thermometer recorded 38.7°C, which, assuming the latter is correct confirms that the sensors are within the ±0.5°C specification. Note that the sensors appear to read on average 0.4C lower than the clinical thermometer.
Data storage and online visualisation
Data are stored in a CSV file on a micro SD card and the card is changed usually every few days up to a week. Initially the data were visualised using the line chart in Microsft Excel, but as this is cumbersome and does not allow the visitor to examine the whole data set in detail, the data were uploaded to emoncms.org (openenergymonitor.org) to take advantage of the horizontally scrollable multigraph visualisation facility there.
The data are uploaded to emoncms.org in a Windows XP cmd.exe window using php.exe (last WinXP version 5.4.45) to call the file bulk.php downloaded from https://raw.githubusercontent.com/Jodaille/DavidHeafHives/master/CsvToEmoncms/bulk.php and edited with the correct APIkey and nodeID. For convenience of editing the command used at cmd.exe, a BAT file with the command line is used. The command line has the form C:\PHP\php.exe bulk.php mydata.exe.
The times are Greenwich Mean Time (GMT). To allow for daylight saving during the period of British Summer Time (26 March to 29 October 2017 inclusive) add one hour.
David Heaf
Email: david (at) dheaf (dot) plus (dot) com
David Heaf's beekeeping pages: www.bee-friendly.co.uk