 Left: the
experimental setup
Left: the
experimental setupWarrť hive thermology studies
Summary
A 2-box Warrť hive full of natural combs fixed to the walls in cold-way orientation and top-bars was heated with a 12 watt heater situated on the top-bars of the lower box. Heat flows through various surfaces were monitored with the help of either temperature sensors fixed to the surfaces or an infra red thermometer. Flows through front and rear walls were approximately twice those of side walls. The flow through the top of the hive was less than 4% of the total. Less than 1% of the heat was lost through the floor.
Introduction
This study was inspired by Mitchell's (2016) research into thermal properties of various hives and cavities that house bees, one of which was a Warrť hive. He found that an empty Warrť hive conducted half the amount of heat to the outside as did a National hive. A Warrť lost 1.3 watts per degree whereas a national lost 2.6. A dung covered straw skep lost 1.0 watts per degree. Mitchell's studies were conducted on empty cavities. Here we look at a hive full of natural combs fixed to the walls.
Methods
Left: the
experimental setup
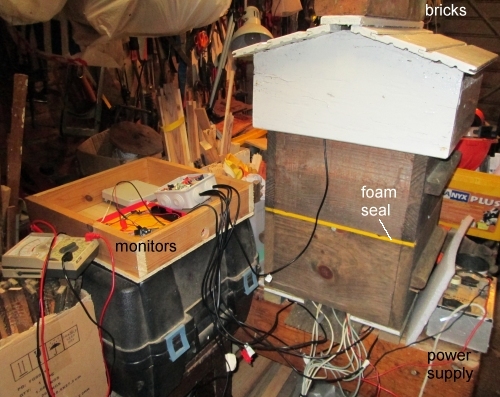
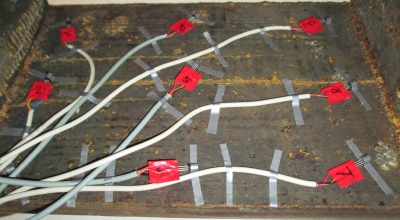
The work was carried out in November and December 2017 in an unheated garage using a 2-box Warrť hive with both boxes full of comb, a top-bar cloth, quilt filled with electric planer shavings and standard Warrť roof and floor. The combs were arranged 'cold-way', i.e. at right angles to the wall with the entrance. To simulate of a bee cluster, an array of heating elements was fixed to the top-bars of the lower box. They were obtained from an electric fire and four pairs of coils were wired in parallel using soldered joints. The heater was powered with a car battery charger with stepwise adjustable voltages supplying about 12 watts. Mitchell used 20 watts in his studies but we considered that too high for a Warrť hive full of comb as it could risk overheating and melting of the combs. The experiment was conducted indoors to avoid influences from solar radiation and wind. Ambient temperatures generally ranged from 8įC to 12įC.
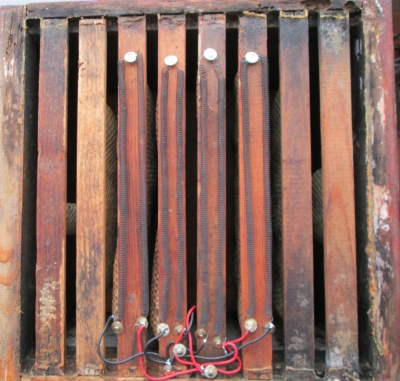 Left: heater
elements on the top-bars of box 2 (lower box)
Left: heater
elements on the top-bars of box 2 (lower box)
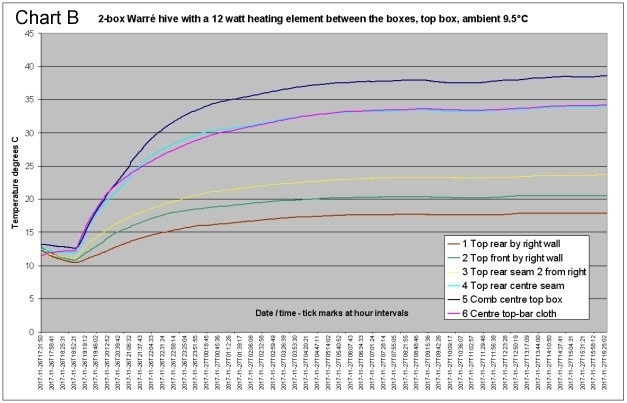
The hive was heated until temperatures remained satisfactorily stable. This took about 12 hours. Temperature changes at various locations in the hive were recorded every thirty seconds using a waterproof Dallas DS18B20 sensors and an Arduino-based digital monitor with a real time clock and micro SD card data storage as described here. Validation of the sensors is shown near the end of this page. The following charts show typical runs at two different ambient temperatures.
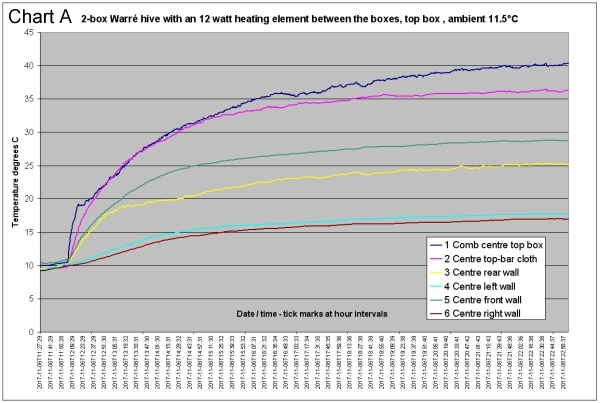
As can be seen from the above charts, the ~12 watt supply produced temperatures at the centre of the top box up to 6 degrees hotter than in the centre of a bee colony rearing brood, and certainly much hotter than a colony in winter which shows cluster temperatures of 15-25įC (Owens 1971). Indeed, the cluster temperature of a Warrť hive colony at the time of this study was about 15įC with an ambient temperature of 9įC.
Furthermore, the temperatures in various parts of the top box in the present study differed greatly by as much as 23įC. Notably, the sensors between the outermost combs and the side walls showed distinctly lower temperatures (15-20įC) than those against the front or rear walls (25-35įC). This is presumably because heat flow sideways through the combs meets more resistance than its flow through the unobstructed bee galleries to the front and rear walls. The bottom box was much cooler being largely below the heating elements. Measurements round the walls were carried out in this box too and ranged from 13.5įC to 16.5įC at an ambient temperature ranging from 10.5įC t 11.5įC.
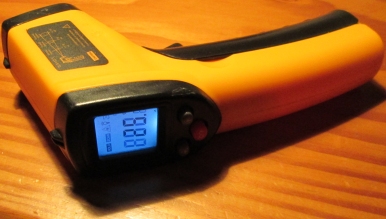
Mitchell (2016) describes a method for measuring the heat loss from beehives which involves calculating the lumped thermal conductance of the enclosure from the average inside temperatures, the outside temperature and the applied power in watts. In his studies there were no combs in the cavities, just the heater and an array of sensors. But with the wide range of temperatures encountered here, such an averaging would be highly inaccurate. So instead, internal temperatures were obtained round the inner surfaces of both boxes and the outside temperatures at corresponding points on the outer surfaces were measured with an infra-red thermometer and/or sensors fixed to the surfaces.
Ten Dallas DS18B20 integrated circuit sensors in TO-92 packages were used for measuring surface temperatures. Validation of the sensors is shown near the end of this page. The flat surfaces on the sensors were held against the walls with duct tape and the wires taken out through notches cut in the box rims. To improve contact with the box surface a small amount of silicone grease was applied to the sensor. Any gaps on the outsides of the boxes were plugged with blutack. A thin layer of foam was inserted between the boxes in place of the propolis seal that would normally be there.
Below left: Nine DS18B20 sensors on a box internal
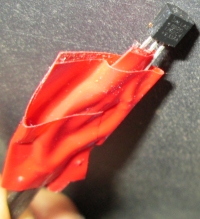
wall Below centre: sensor close-up showing flat surface
Below right: IR thermometer of unknown brand (validation shown at the end of this
page)
As the inner sensors were recording every 30 seconds together with real-time clock reading, the time of the external IR thermometer readings was recorded so that the temperature at the same time internally could be used in subsequent calculations of heat flows. This was intended to compensate for the slight drift due to slow changes in ambient temperature in the garage laboratory. The tenth sensor was used to measure temperatures at various points on the box walls corresponding to the internal sensors. This was done by fixing the sensor at the appropriate position on the box wall and allowing it to stabilise for about 30 minutes after each move.
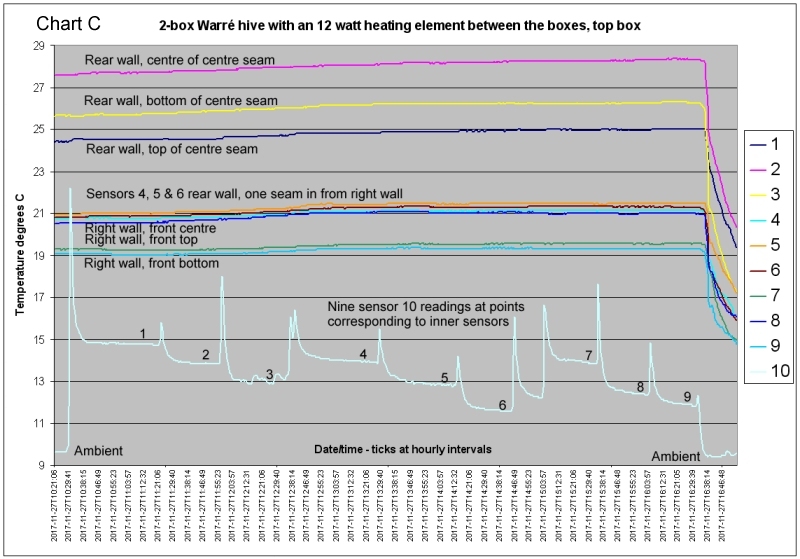
As comb ends were partly fixed to rear the wall, it was necessary to remove four combs on one side to fit the sensors. A knife with a thin blade was used so as to minimise damage to the comb-wall interface. Sensors were positioned as shown in chart 'C' below. In a separate 12-hour run, 8 sensors were attached to the outside of the rear wall at 18 mm intervals to correspond to four beeways and four comb ends. The average for the beeways was 14.68įC and for the comb ends 14.65įC, indicating no significant difference in temperature is detectable outside the hive.
Chart 'C' shows an example 'run' comprising nine internal sensor traces and that of sensor 10 as it was moved from position to position on the box walls. Each run requires an overnight stabilisation of box temperatures of at least 12 hours. The peaks in S10 trace are caused by unavoidable warming by the fingers as the sensor was moved to the next position. This 'run' took place at an ambient temperature of 9.5įC.
Right wall and rear wall measurements were carried out on both boxes. As satisfactory thermal symmetry was verified with the IR thermometer, no separate runs were necessary for front and left walls.
Temperatures for roof and floor heat flows were measured only with sensors because of the practical difficulty of taking IR readings. For measuring heat flow through the top-bar cloth, quilt and roof, all ten unencapsulated DS18B20 ('naked' TO-92 packages) were distributed as evenly as possible over the top-bars. The encapsulated sensors in their stainless steel sheaths were distributed inside the roof cavity. For the floor measurement, nine DS18B20 ('naked' TO-92 packages) were fixed to the inside surface of of the floor and five encapsulated sensors were placed under the floor.
Effect of reducing the heat source to about 5 watts
As already mentioned, winter cluster temperatures are as low as 15-25įC (Owens 1971). To see what heater power would be needed to produce such temperatures in the top box of the Warrť hive full of combs, the heater power was considerably reduced from the 12 watts used in the rest of this study. Approximately 5 watts was chosen and the hive warmed overnight. Chart 'D' below shows the results, the upper dark blue trace best representing the temperature of the upper edge of the simulated cluster as it was in the centre of the combs of the top box. It reached 22įC before starting to fall slightly again due to a fall in the ambient temperature.
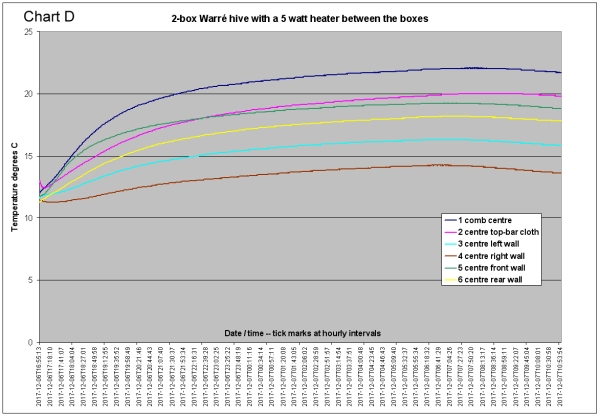
A survey of hive weight losses over winter, showed the modal value to be 0.05 kg per day (Heaf 2017). Assuming all this weight loss represents honey consumed, it corresponds to an energy supply of 7.6 watts through the metabolism of the sugars in honey. The survey included all types of hives many of which were larger, with larger clusters than Warrťs and some were situated in very cold climates. The winter honey consumption in Warrť hives is likely to be generally lower than 0.05 kg/day. Indeed, some of the data in the aforementioned survey is for unusually thick-walled Warrť hives and show weight losses below 0.03 kg/day, which corresponds to an energy production of 4.5 watts, close to the 5 watts used for the simulation in chart 'D'.
Edge effects and form factors
In calculating the heat flows no consideration was made of edge effects normally taken into account by form factors. The calculations therefore refer to flows taking place normal to the surfaces from the inside to the outside. One reason for omitting form factors was that the study involved comparing different flows through eight different surfaces all of which have edge effects, three edges in the case of each wall and four in the case of floor and roof. So in a comparison of surfaces there would be a fair measure of cancelling out of edge effects. Another reason was that edge effects are probably small because the lowest temperatures occur at the corners. And at the base of the quilt, where the horizontal edges may be somewhat warmer because they are at the top of the cavity, the distance between inside and outside is far larger than the thickness of the walls as the quilt is constructed of 100 mm x 20 mm pine. Consequently the heat losses here will be correspondingly lower. Floor heat flows were lowest of all. Therefore edge effects here would contribute very little to the overall error of measurement.
Thermal symmetry
So that heat flow measurements could justifiably be confined to one side wall and one front or rear wall, it was necessary to check thermal symmetry. This was done with an IR thermometer on the outer walls of the top box. Nine readings were taken distributed evenly over each side and the results averaged as follows: front wall 10.6įC, rear wall 10.9įC, right wall (viewed from rear of hive) 10.3įC, left wall 10.2įC. These results were taken as evidence of satisfactory thermal symmetry.
Results: heat flow calculations
This was done using a Microsoft Excel spreadsheet and the following data:
Conductivity of larch hive box walls: 0.125 w/m.įK (various
Internet pages give 0.12 or 0.13 W/m.įK)
Conductivity of planer shavings: 0.04 w/m.įC (Porschitz & Schwarz,
2000)
Conductivity of pine mouse board and floor components: 0.12 w/m.įC
Internal area of box walls: 0.063 m2
Internal areas of floor and roof: 0.09 m2
Thickness of front & rear walls (rebates ignored): 0.025 m
Average thickness of side walls including handles: 0.0277 m
Depth of quilt filled to top with planer shavings: 0.1 m
Thickness of mouse board in roof: 0.016 m
Average thickness of floor, taking into account battens and alighting board: 0.033 m
Charts A and B, when compared with actual temperatures in a Warrť hive at the time of this experiment in winter, details of which can be found here, show that the the nominal 12 watt heater was supplying too much power. For example, actual cluster temperatures were varying between 15įC and 25įC, whereas the sensor which best represented cluster temperature in this experiment with a heater simulating cluster heat production, namely the one in the centre of the comb in box 1 (dark blue curve in charts A and B), reported temperatures of 37-40įC.
The following table shows heat transfers through various surfaces of the hive measured with both infra red and DS18B20 sensors.
With IR readings (boxes only) |
DS18B20
readings |
|||
| Box 1 | Watts | % of total | Watts | % of total |
Right wall |
1.49 |
11 |
1.56 |
12 |
Left wall |
1.49 |
11 |
1.56 |
12 |
Rear wall |
2.74 |
20 |
3.07 |
23 |
Front wall |
2.74 |
20 |
3.07 |
23 |
Walls total |
8.46 |
62 |
9.26 |
69 |
Top-bar cloth, quilt & roof |
0.49 |
3.6 |
0.49 |
3.6 |
Total box 1 |
8.95 |
66 |
9.75 |
73 |
| Box 2 | ||||
Right wall |
0.84 |
6 |
0.76 |
5.7 |
Left wall |
0.84 |
6 |
0.76 |
5.7 |
Rear wall |
1.46 |
11 |
1.02 |
7.6 |
Front wall |
1.46 |
11 |
1.02 |
7.6 |
Walls total |
4.60 |
34 |
3.56 |
27 |
Floor |
0.095 |
0.7 |
0.095 |
0.7 |
Total box 2 |
4.70 |
35 |
3.66 |
27 |
TOTAL |
13.6 |
13.4 |
||
Total heat flows from the hive measured by IR thermometer (13.6w) or DS18B20 sensors (13.4w) were somewhat higher than the applied wattage. The voltage across the heater was 8.2V and the current shown on the power supply 1.53A, giving a wattage of 12.5. A plausible source of at least part of the discrepancy is that the sensors, though fixed to the surfaces, projected somewhat and therefore were affected by the temperature of the air nearer the surface. This air temperature was likely to be higher than the actual surface temperature. Indeed, in a test of 5 sensors fixed to a surface and 5 sensors in the air near them, those in the air averaged 1.5įC higher. A slightly higher reading for the inside of the hive wall and a slightly lower reading for the outside could be the consequence, thus raising the temperature differential between inside and outside and in turn resulting in a slightly higher wattage. However, this cannot fully account for the discrepancy especially as the total wattage accounted for was also high when the IR thermometer was used to measure outside wall temperatures.
Heat flows through front and rear walls were approximately double those of the side walls. This is most likely because flow sideways from the centre through comb faces meets more resistance than forwards and backwards through the beeways between the combs. This clearly illustrates the difference between 'cold way' and 'warm way' in comb orientation.
The flow through the top of the hive accounted for only 3.6% of the total heat flow. This should not be too surprising considering the combined R-value of quilt and roof is about 2.6 m2K/W whereas that of the walls is only 0.2 m2K/W.
Validation of thermometers
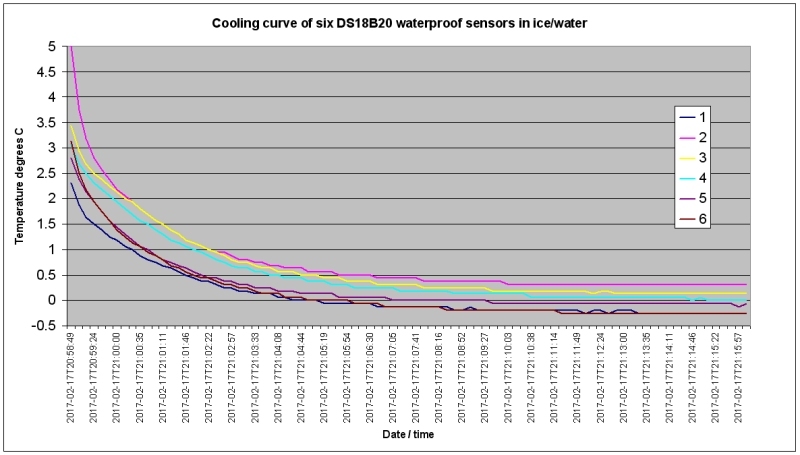
The six encapsulated, waterproof DS18B20 sensors were placed in an ice and water mixture and left to stabilise for fifteen minutes while stirring the mixture. All sensors were within 0.5įC of each other with traces scattered with satisfactory evenness round zero įC
The 'naked' DS18B20 sensors, not being waterproof, were tested at room temperature.
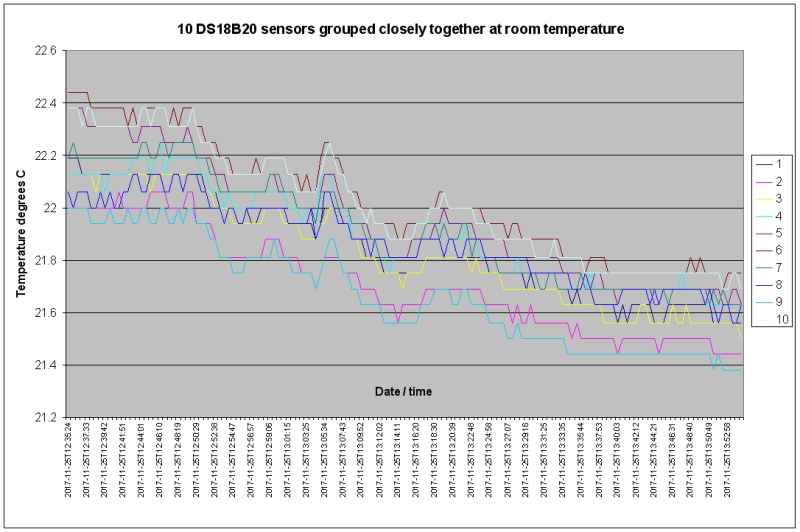
The average temperatures for the 10 sensors was (in numerical sequence): 22.0, 21.8, 22.0, 22.0, 22.1, 22.2, 22.0, 21.9, 21.8, and 22.1. Thus all were within 0.4įC of each other.
The infra red thermometer was tested using a water and ice mixture as follows. A kitchen utensil with a thick matt black plastic handle was placed in the iced water for several minutes. It was then removed, quickly wiped dry and immediately 'read' with the IR thermometer in contact with it. Then it was replaced in the ice and water mixture and the test repeated several times. The results were as follows: -0.1, 0.1, 0.1, -0.1, -0.1, 0, 0, -0.1įC. This was taken as an indication that the thermometer was reliable.
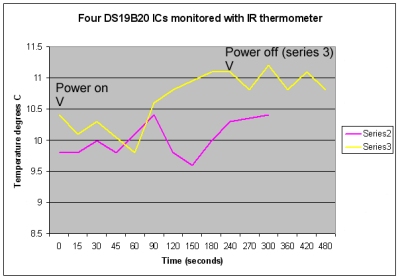
Investigation of possible heating effect of sensors
The operating current of a DS18B20 sensor is up to 1.5 mA. Since this could conceivably cause a heating effect and bias the temperature readings evidence for such an effect was sought. Four sensors were placed touching each other in a square arrangement. Their combined temperatures were measured with an IR thermometer held 5 mm above them and the power turned on. Temperature readings were taken at intervals. This was repeated with after an hour had elapsed. On the repeat, the power was turned off and monitoring continued for three minutes.
The results are shown on the following chart. There appears to be no clear evidence of a heating effect with the test setup used.
References
Heaf, D. J. (2017) Survey of honey bee winter weight loss rates for Apis mellifera hives in USA, Europe and Japan. http://www.dheaf.plus.com/warrebeekeeping/winter_hive_weight_loss_rates.pdf
Mitchell, D. (2016). Ratios of colony mass to thermal conductance of tree and man-made nest enclosures of Apis mellifera: implications for survival, clustering, humidity regulation and Varroa destructor. International Journal of Biometeorology, 60(5), pp.629–638. Available at: http://dx.doi.org/10.1007/s00484-015-1057-z .
Owens, C. D. (1971) The thermology of wintering honey bee colonies. Technical Bulletin No. 1429. USDA Agricultural Research Service.
Porschitz, H.R. & Schwarz, B. (2000) Wood shavings as insulating material for prefabricated low energy homes. http://timber.ce.wsu.edu/resources/papers/4-2-1.pdf
See also:
Comparison of heat flows from a National hive
and a Warrť hive
and
Measurement of the lumped thermal
conductance of a Warrť hive enclosure.