Arduino-based 6-sensor Temperature Monitor for Bee Hives
Acknowledgements
Thanks due to Jody Noury for putting this kit together and for supplying the code for the multigraph viaualisation of the data. Thanks also to Clive and Glyn Hudson for their hive monitoring project which provoked me to try doing one myself.
Related projects
Glyn, Clive & Shân Hudson's National hive monitor: www.beemonitor.org
Jody Noury's Warré hive monitor with time-lapse photos: www.jodaille.org & www.jodaille.org/snapshots/
Open Source Beehives: http://opensourcebeehives.net/
Arnia Remote Hive Monitoring: www.arnia.co.uk
Hive Tool: www.hivetool.org
Hive Eyes: https://community.hiveeyes.org/
Monitor technical details
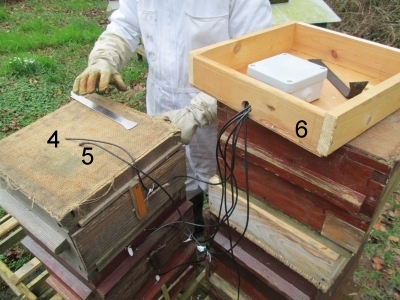
The monitor is based on an Arduino Pro Mini board with a real time clock, micro SD card writer/reader, a 18650 4.2V battery, and six DS18B20 waterproof temperature sensors.
A fuller account of the equipment is here.
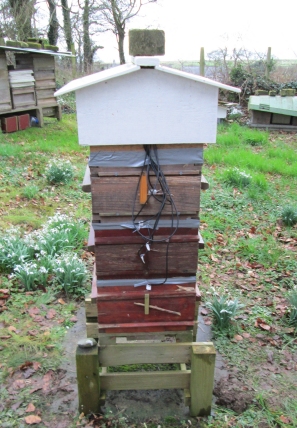
Installation in a Warré hive on 20 February 2017
The monitor was installed under the roof of a 3-box Warré hive (with rear windows) in a 70 mm deep eke and the sensor wires fed to the lower boxes through 'U'-shaped slots between the top-bars in the box rims.
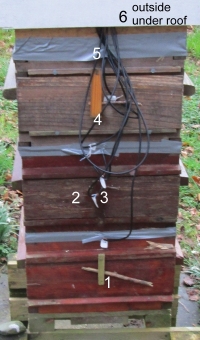
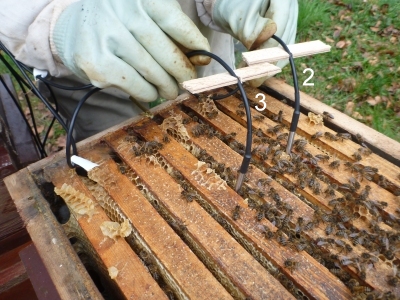
Sensors 1, 2 and 3 were slightly forward of the middle of the box and about 100 mm deep between the combs. Sensor 3 was in the middle bee seam of box 2 and sensor 2 two seams away from it. Sensors 4 and 5 were inserted through holes in the top-bar cloth with sensor 4 about 150 mm deep and sensor 5 just under the cloth. Sensor 6, for measuring ambient temperature, was placed in slot on the back of the eke and secured with a staple. Sensor 6 is situated outside of the hive just under the roof rim, so not exposed to rain. The hive faces approximately south so this sensor is expected to be little influenced by direct sunshine, especially in the winter.

Boxes 1 (top) and 2 were hefted prior to installation and, surprisingly for the time of year, together weighed nearly 3 kg more than on 4 October 2016. The subsequent honey-syrup supplementary feed together with the intense nectar flow that autumn could account for the gain.
As propolis seals between boxes 1 and 2 as well as between boxes 2 and 3 were broken during the installation, it was necessary to temporarily reseal these seams against draughts until the bees could repropolise them. The seams were therefore covered by adhesive tape. This was also especially important for the seam between the quilt and box 1 which was now exposed to the elements but is normally sheltered by a 20 mm overhang of the roof's lower rim.
From installation on 20 February 2017 to 25 April 2017 data were also visualised using a Microsoft Excel chart . The charts are archived here. After 20 April the whole data set was uploaded to emoncms.org in order to use the more flexible multigraph visualisation there.
Multigraph visualisation of Warré
temperature data at dhmonitor.jodaille.org
(using emoncms.org powered by openenergymonitor.org)
NB. Boxes are numbered from the top of the hive. Initially three boxes but from 7 April 2017 four boxes.
The graph data end on 1 August 2017. NB. Times are Greenwich Mean Time (GMT) throughout.
Comments on the multigraph
At installation on 20 February 2017 only a bee seam east of centre in box 2 (numbering from the top) was at brood temperature (~34 degrees C). By 23 March the centre seam of box 2 was consistently at brood temperature. Large rises in temperature in box 3 were also recorded from this date but this box did not reach consistent brood temperature until 13 April.
On 23-24 April there were some unexplained rises of up to 3 degrees C in brood temperature at all three locations taking about an hour to return to normal.
By 4 May the lower sensor in box 1 was closely approaching brood temperature. After 13 May this box cooled down, possibly reflecting that this box was mostly stores and the nest was growing downwards.
20 May: The 4th box, which was nadired on, 7 April now has a large cluster of bees and waxmaker chains. As the entrance is visible from the bottom of the window, this box is estimated to be about half full of bees. No comb is visible yet.
10 June: After a long period with fairly constant brood temperatures in boxes 2 and 3, the values began to drop below brood temperature at times. Meanwhile there was a large cluster of bees in box 4 and comb was expanding towards the window. Although there is no evidence of there having been a swarm from this hive, which is usually signalled by combs in the bottom box becoming almost bare, it is possible that there has been a queen supersedure and a cessation of laying. This may account partly for the erratic temperatures later in June, although the high ambient tomperatures on some days could have contributed to this.
24 June: Persistent deviation from brood temperature began.
2 August 2017: As no recovery in brood temperature occurred and the colony was showing signs of queen failure for the past weeks, monitoring was discontinued.
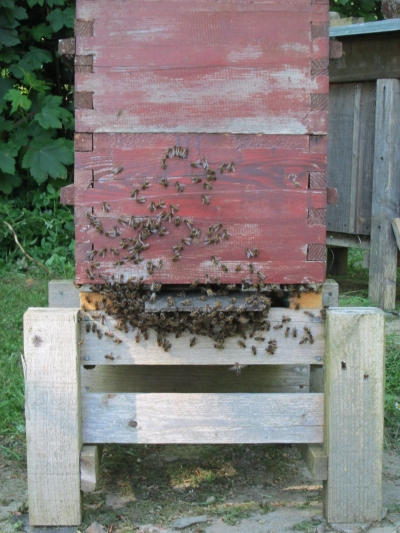 Bearding on 26 May 2017,
ambient temperature 26C
Bearding on 26 May 2017,
ambient temperature 26C
See also: 6-sensor temperature monitor of a modified Lazutin hive here.
David Heaf
Email: david (at) dheaf (dot) plus (dot) com
David Heaf's beekeeping pages: www.bee-friendly.co.uk