Warré hive scales and data loggers construction
Scale 1 (with single 200kg load cell)
The following describes a weighing scale with a single point 200 kg load cell attached to an Arduino Uno clone via a HX711 amplifier that contains an analogue to digital converter. The Arduino has attached an SD card writer, real time clock and DS18B20 onewire temperature sensor. Power is from a 6V 12AH sealed lead-acid battery charged via a PWB solar charge controller fed by two 6V panels in series, rated at 3W and 5W respectively.
The 200 kg Chinese load cell was obtained from eBay for £10. I was warned off these, but had already bought one. A better quality choice would be the Bosche H30A but it costs 50 Euros.
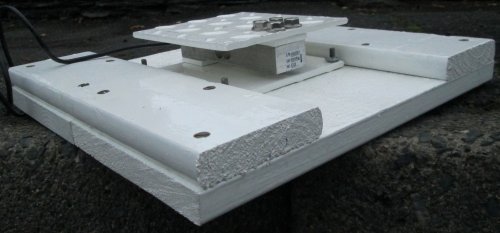
The following picture shows the cell mounted between two steel plates and bolted to the hive scale base board. 20 mm plywood (weather-proof board) would probably suffice for the board but I was unable to source such small pieces. The plates are 150 mm square and the base board 350 mm square.
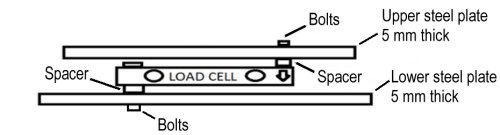
The following diagram shows the load cell mounting. The centre of the cell is positioned at the centre of the base board.
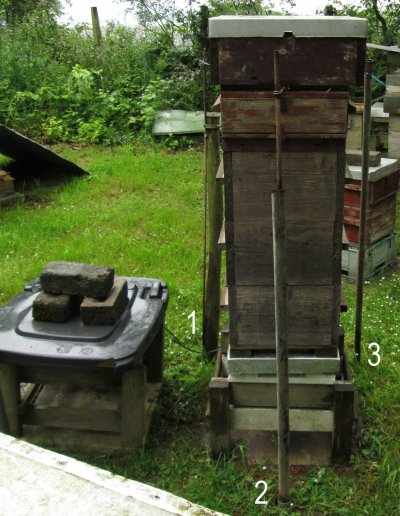
The following photo shows the scale in position on the hive stand with the hive ready to be lowered onto it with a Gatineau lift. In the corners of the scale between the upper and lower boards are shim packs comprising 40 mm square sheets of lead and aluminium. These are adjusted in thickness so as to be easily movable when the scale is fully loaded and they serve to protect the load cell against overload, e.g. by accidentally dropping a hive box on the scale.
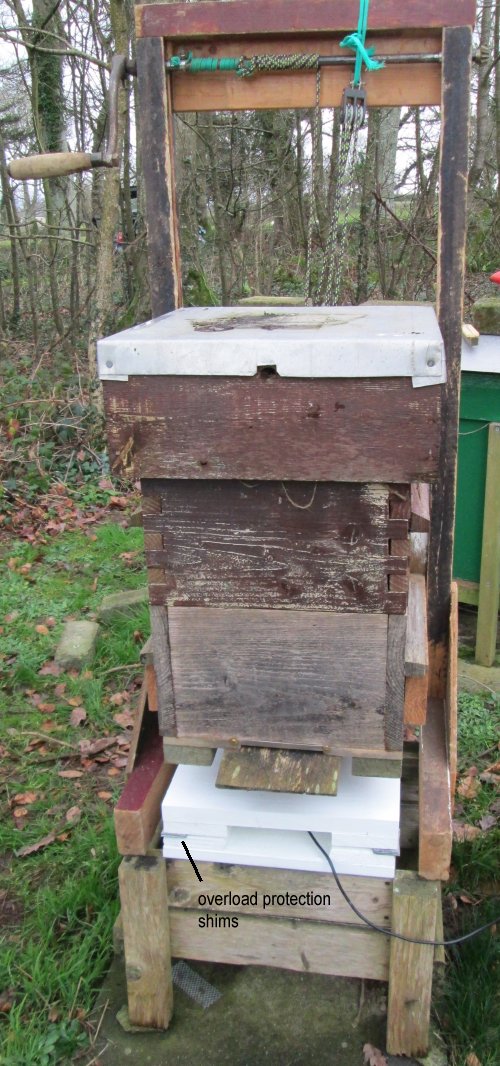
This is the same hive that was used for temperature monitoring in 2017-2018, but now fitted with a 'National' type roof for ease of positioning the hive lift.
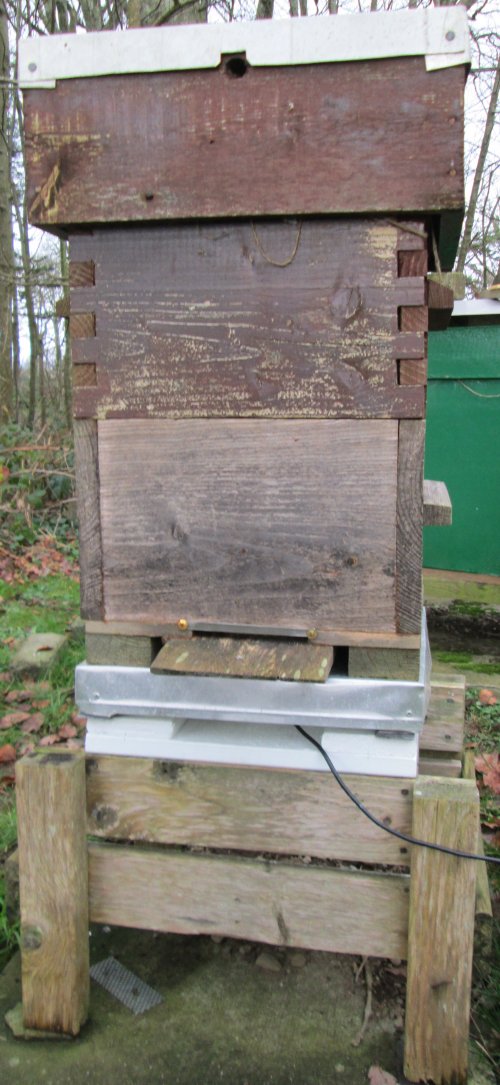
The following photo shows the complete scale installed with an aluminium rain cover over the scale's top board. The overload protection shims are still accessible with the cover in place.
Data logger electronics
The following photo shows a separate housing with the electronics. Regulated 3.3V or 5V power for the clock, SD card and temperature sensor is supplied by the Arduino Uno. The power to the Arduino is from a 6V 12AH SLA battery.
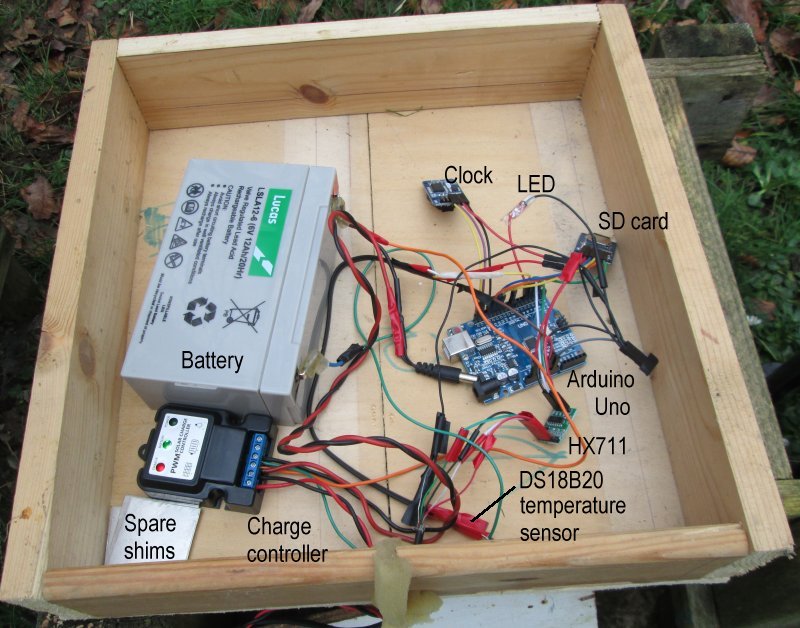
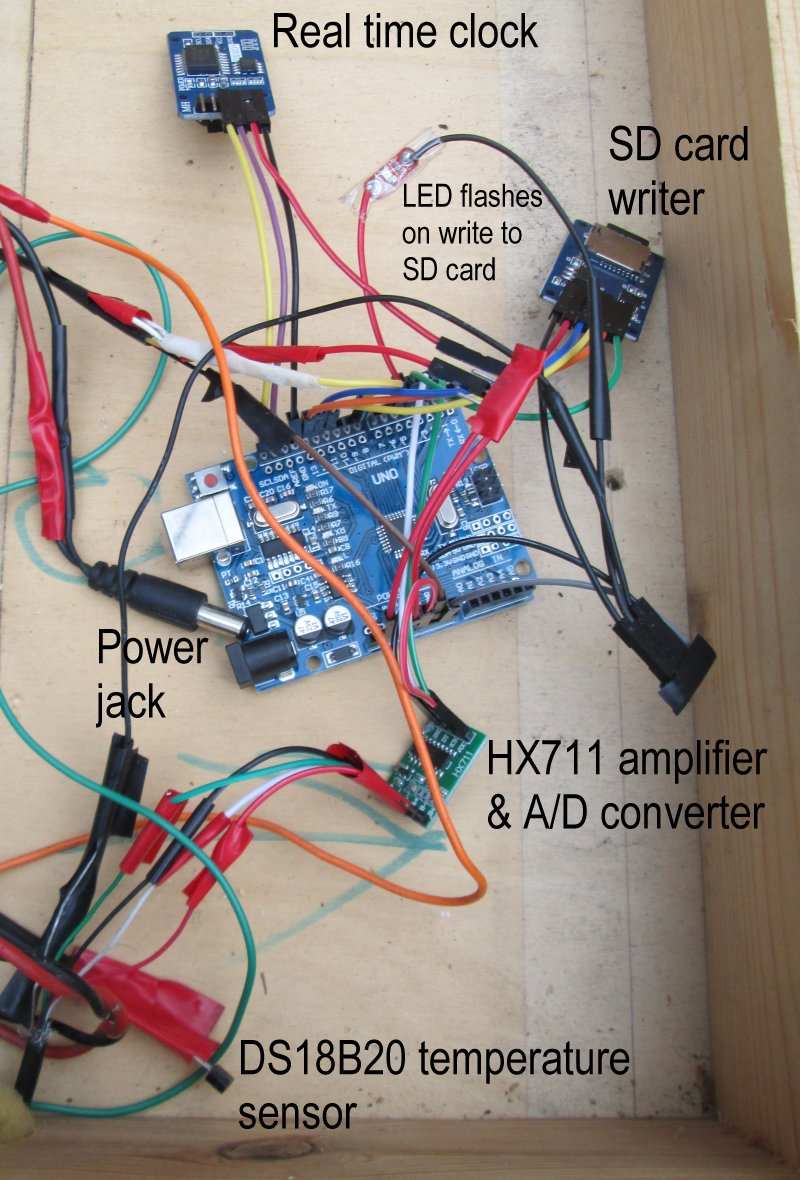
The following photo shows a close-up of the electronics. The Arduino sketch has provision to flash a LED when the Arduino writes to the card. This is included as a means of ensuring that the setup is working. The first flash comes a few seconds after starting (power on) and the card records the tared weight, usually a few grams above or below zero.
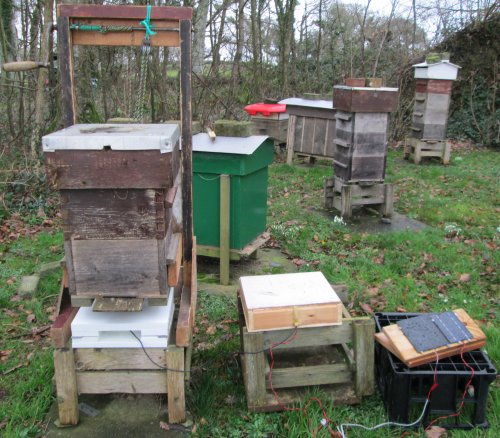
The following photo shows the hive, lift, scale, electronics unit and solar panels.
The sketch is adapted from a previous sketch used to monitor hive temperatures. The principal adaptation involves adding an HX711 library and using the application example included with it. As this in default mode makes a running average of 16 samples of the weight, to ensure reporting of the current weight, 16 load cell update calls are made at each cycle through the loop. Furthermore, the loop cycle time was changed from the previous 30 seconds to 3 minutes. Download sketch.
Calibration
The scale was powered on to tare it and a 25 kg weight placed on it. Using the 'Calibrate' example in the HX711 library the calibration factor was adjusted to display the correct weight in grams. In this case the factor was found to be 20.2. This value was incorporated into the hive scale sketch.
Operation
Lift the hive and insert the scale with its cover on the stand. Power on the Arduino Uno by plugging in the power jack. The Arduino power LED lights up. After a few seconds the SD card write LED flashes. The scale is thus tared and the hive can be gently lowered onto the scale. If there is sufficient light, even if overcast, the red charge light will show on the PWM solar charge controller. Put the inner cover and rain cover on the electronics unit.
To change the SD card: lift the hive off the scale with the hive lift. Disconnect the power jack from the Arduino. Change the card. Power on again and wait for the first LED flash. Close up the electronics. Lower the hive back onto the scale.
Performance
Frequently discussed is the issue of load cell creep or drift, i.e. the reported weight slowly changes with time. It is said that load cells are not meant to carry constant loads, least of all above 10% of their rating. So the first test carried out was 5 days outdoors with the 25 kg calibration weight on the scale. The results are shown below with a greatly enlarged y-axis scale (weight) to show the creep trend clearly.
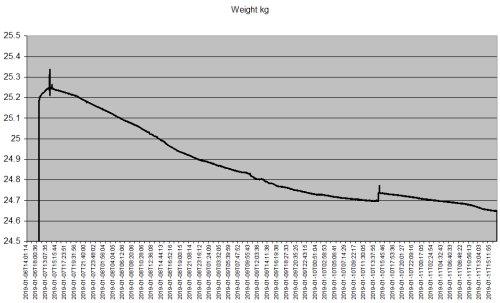
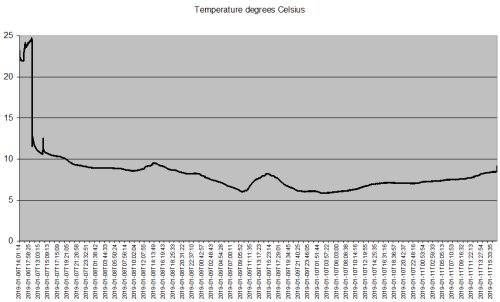
There was a drop in weight, totalling about 0.6 kg or 2.4% of the calibration weight. The creep was not obviously correlated with temperature changes over the 5 days. The rate of drop in weight, i.e. the steepness of the slope on the graph, decreased somewhat over the 5 days of the test.
The following graph is the emoncms multigraph visualisation of the data. Comments on this graph and changes to the hive are presented here.
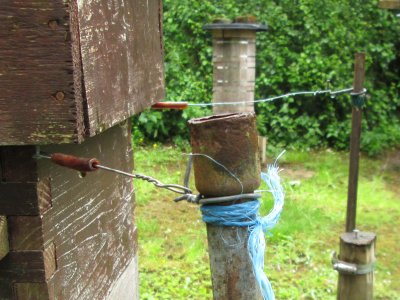
Addition of tethers after nadiring boxes.
At the beginning of April and on 24th May 2019, 3rd and 4th hive body boxes were nadired to cope with colony expansion. With the addition of the third box, the hive was seen to rock in high winds. Therefore two tether posts were installed on the least sheltered side of the hive, namely the front. The rocking worsened with the addition of the 4th box, so a third post was added to the rear of the hive. This rocking took place despite the corner shims between the upper and lower scale boards being set to leave a gap of less than 1 mm. The tethers used were made of wire that located round a nail on the underside of the roof rim and at the other end round a hook on the tether post. As they were positioned horizontally and of insignificant weight relative to the hive, they did not interfere significantly with the recorded weights.
Improvements
The sketch could do with some tidying up and there are probably better ways known to Arduino experts of compensating for the running average inherent in the HX711 library, as well as for inserting a 3-minute delay between writings of the scale reading to the SD card.
Weather protection for the scale baseboard would be an advantage but it is not clear how to include it without obstructing access to the overload protection shims and/or interfering with the scale reading.
This Arduino Uno clone seems to be particularly greedy for current. Between readings it used 35 mA and this briefly rises to 50 mA when writing to the card. Some reduction of current consumption could be achieved by destroying the power-on LED. Further reduction might be achieved with another type of Arduino board, modified or unmodified, and a sketch with provision to put the board into deep sleep.
The power supply initially used may be less than ideal. With a previous hive monitor a Ceech Astri Arista board was used that has a built-in solar charge controller and runs on one 18650 Li-ion rechargeable battery. The hive scale here has a 12 AH battery which should give about 12 days power at 40 mA. The solar panels should compensate somewhat for the current used, but as they supply only about 100 mA during charge, and the controller uses about 10 mA to run itself, even at night, the battery may need periodically removing for recharging.
On 17 December 2019 the scale datalogger thoroughly revised. The sketch used in Scale 2 (see below) was uploaded into the Arduino Uno and the following changes made: Const Int Chipset = pin 10 (moved from 4); SQW on realtime clock on pin 2; HX711 on pins 3 & 6; blinking LED on pin 7; calValue remained at 20.2 after re-checking with scale/HX711 calibration sketch; tareOffset = 135759536 (stored in EEPROM).
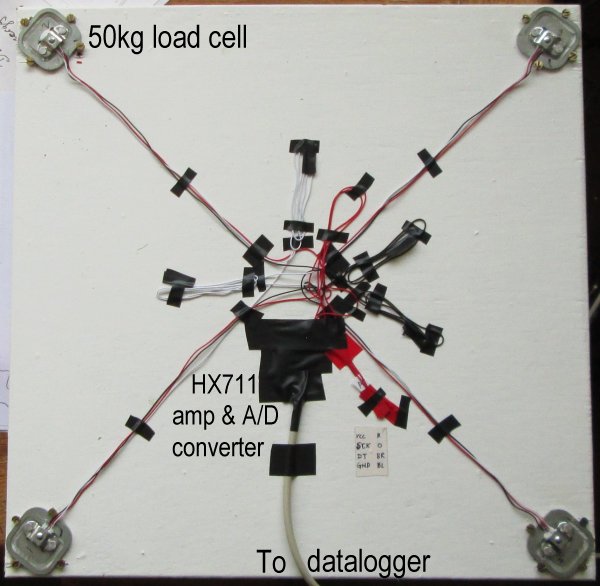
Scale 2 (with 4 x 50kg load cells)
As the single 200kg load cell scale is somewhat unstable in wind, this second scale was made with four 50kg load cells sandwiched in each corner between two pieces of 18 mm ply, which was painted to weatherproof it. The photo below shows the layout. The HX711 amplifier and A/D converter is housed in a recess in the board. Shallow recesses were cut in the board under the middle of each load cell to avoid any restriction of its movement under load. The scale was covered with aluminium sheet folded down at the edges to keep rain off. The HX711 is connected to the datalogger with screened computer cable.
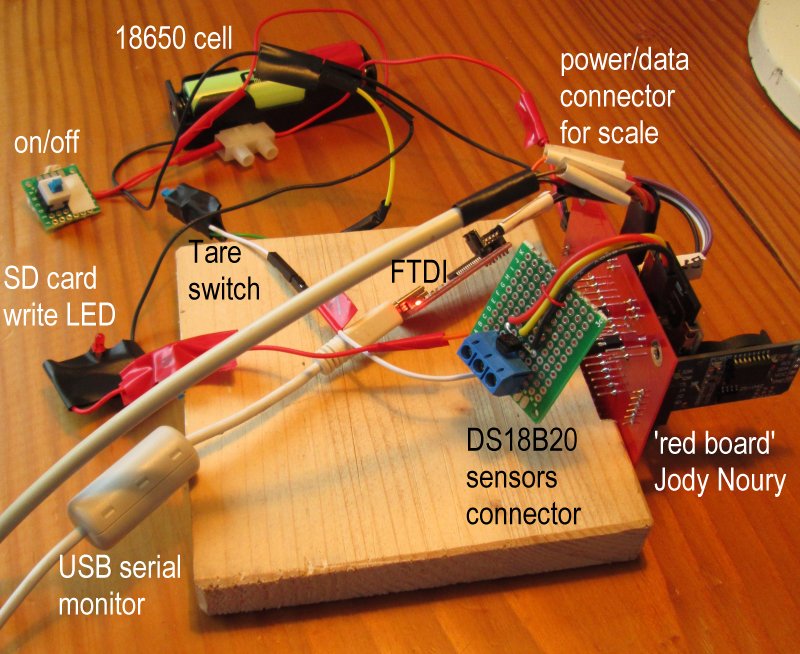
The datalogger was kindly supplied by Jody Noury (Caen). It comprises an 8MHz 3.3V Arduino Pro Mini mounted on his 'red board', a secondary breakout board which eases connection to all the peripheral devices, namely the DS18B20 temperature sensors, HX711 amplifier and A/D converter, 18650 cell power supply, DS3231 real-time clock with EEPROM, SD card writer and, for programming, the FTDI adapter for the USB cable including serial monitor. Details of this printed circuit board, built with Kicad, are shown here. For recording ambient temperature, there is a single DS18B20 temperature sensor with its pull-up resistor on the green board shown in the photo below.
The main sketch, written by Jody Noury, and additional special library files are downloadable here. This sketch was supplemented with a few lines to light a LED for 2 seconds if a write to the SD card is successful. The LED circuit is connected (with a switch) only when checking that the datalogger is successfully writing to the card. The sketch is set to write to the card at 3 minute intervals.
Following suggestions by The Cave Pearl Project, by removing unnecessary components including disabling LEDs on the clock and Arduino boards (components marked with a red asterisk here, and described in detail here), as well as, when not reading, powering down the HX711 and load cell, as well as putting the Arduino in sleep mode ('LowPower.powerDown' in the sketch), the datalogger easily runs for a week on a single 18650 Li-ion cell.
The scale calibration factor was determined with a 13.5kg weight and the factor inserted in the main sketch. The sketch makes use of the EEPROM to store the tare value. Taring is done in the workshop, before deploying the scale, using Olav Kallhovd's sketch 'Read_1x_load_cell' which is downloadable here. The taring is achieved by operating a switch which grounds pin 7 through a 1k resistor.
The electronics is housed in a weatherproof and insect proof box next to the hive.
The effect of ambient temperature on the scale readings was investigated with the 13.5 kg weight at various temperatures outdoors and indoors, and found to be too great to be ignored. The following graph shows the results:
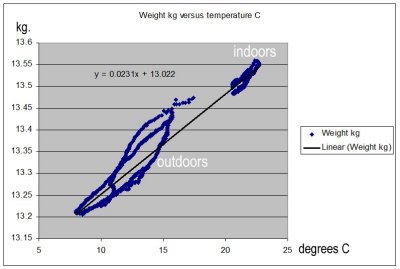
The regression line fitted to the data shows a positive slope of 0.0231 kg per degree C. As the scale was calibrated indoors at 22°C, at temperatures above 22°C weights require a subtraction and at temperatures below 22°C weights require an addition. The formula is: corrected weight = recorded weight + ((22 - ambient temperature) x 0.0231). The correction is made in a spreadsheet of the SD card data prior to uploading to the EMONCMS multigraph visualisation.
The data for this scale placed under a 3-box Warré hive are shown in an EMONCMS multigraph visualisation here . Normally data are uploaded on a weekly basis. Very straight lines on the temperature and weight traces indicate a temporary loss of data. Hover the mouse pointer over the chart to reveal the navigation controls (top right). Click on the temperature or weight colour key (top left) to show only one or the other data set.
Costs
Asked by a reader how much it all cost, I checked back in my eBay purchase confirmation emails to get the figures. Here are the prices in GB pounds for purchases in 2019 and 2020:
4 Load cells with HX711 A-D converter board 3.49
Arduino with headers 3.74
SD Card board 1.85
SD card 2.99
Reat time clock 2.44
Battery holder 0.99
18650 battery (from defunct laptop battery unit)
40 Jumper wires 1.89
Switch 0.40
Temperature sensor 0.72
FTDI for uploading sketches 2.99
Total, £21.50
Acknowledgements
Thanks are due to Stephen Bird (Germany) and Achim Pfaff (imker-stockwaage.de) for guidance on design, not forgetting of course Arduino users everywhere who share their project details and sketches online. Jody Noury (Normandy) kindly tested and provided the sketches: firstly the temperature monitor sketch on which the scale 1 project is based, and secondly the weighing scale sketch with power saving for scale 2 project. He also generously provides the web space to host the EMONCMS data visualisations. I thank Olav Kallhovd for the HX711_ADC library and examples and the Cave Pearl Project for the datalogger power saving suggestions.
References
Hive temperature monitor with sketch for SD card data logger and sources of several items
HX711_ADC Library of Olav Kallhovd
www.imker-stockwaage.de Achim Pfaff's site
Example source of 200 kg load cell (warning: some have unconventional colour coding of their wires)
Contact
david (at) dheaf (dot) plus (dot) com