Arduino-based 6-sensor Temperature Monitor for Bee Hives
Acknowledgement: thanks due to Jody Noury for putting this kit together.
Related projects:
Glyn, Clive & Shân Hudson's National hive monitor: www.beemonitor.org
Jody Noury's Warré hive monitor: www.jodaille.org
& www.jodaille.org/snapshots/
Open Source Beehives Fab Lab Barcelona: www.fablabbcn.org/0000/01/08/open-source-beehives.html
Arnia Remote Hive Monitoring: www.arnia.co.uk
Hive Tool: www.hivetool.org
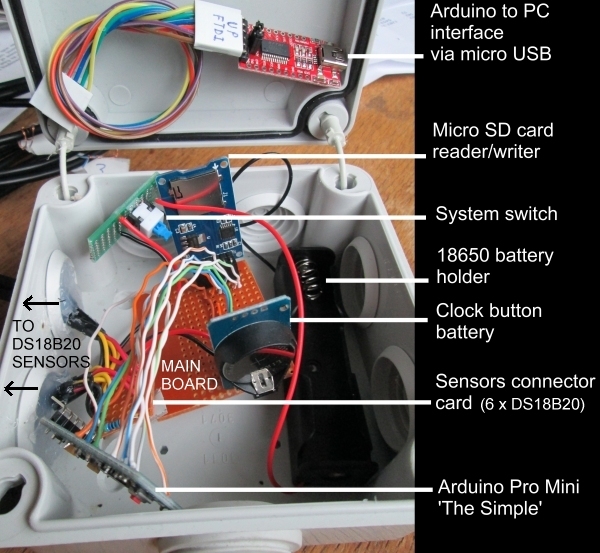
FT232RL FTDI Serial Adapter Module Mini Port for Arduino USB to TTL 3.3V / 5.5V Source
System switch for 18650 battery power on/off
Includes 3.3V Voltage Regulator (XC6206P332MR 3.3V 662k SOT-23 TOREX LDO) Source
Micro SD Storage Board SD TF Card Memory Shield Module SPI For Arduino Source
Real Time Clock (DS3231 AT24C32 IIC precision RTC module / memory module for Arduino) Source
Arduino Pro Mini (atmega328 3.3V 8M board) Source
DS18B20 Probe Waterproof Temperature Sensors Thermistor Control (x 6) Source
Arduino programmed to save to card every 30 seconds. Sleeps the rest of the time.
To save power, the power LEDs on both the Arduino and RTC boards were removed.
Sketch: DavidHeafHivesMonitor.ino
Typical data output
showing date/time and a column for each of the six DS18B20 temperature (degrees C) sensors:
| Date time | S1 | S2 | S3 | S4 | S5 | S6 |
2017-02-07T21:18:24 |
22.81 |
23.44 |
23.81 |
23.19 |
22.5 |
23.56 |
2017-02-07T21:18:58 |
22.81 |
23.44 |
23.81 |
23.19 |
22.5 |
23.56 |
2017-02-07T21:19:32 |
22.81 |
23.44 |
23.88 |
23.19 |
22.5 |
23.56 |
2017-02-07T21:20:05 |
22.81 |
23.5 |
23.88 |
23.19 |
22.56 |
23.56 |
2017-02-07T21:20:39 |
22.88 |
23.5 |
23.88 |
23.19 |
22.56 |
23.56 |
2017-02-07T21:21:13 |
22.88 |
23.5 |
23.88 |
23.25 |
22.56 |
23.56 |
2017-02-07T21:21:46 |
22.88 |
23.5 |
23.88 |
23.25 |
22.56 |
23.56 |
2017-02-07T21:22:20 |
22.88 |
23.5 |
23.94 |
23.25 |
22.56 |
23.63 |
2017-02-07T21:22:54 |
22.88 |
23.5 |
23.94 |
23.25 |
22.56 |
23.63 |
2017-02-07T21:23:28 |
22.88 |
23.5 |
23.94 |
23.25 |
22.63 |
23.63 |
Connection scheme
Sensors |
||||||
Arduino |
RT clock |
micro SD |
DS18B20 |
|||
VCC |
3.3V bus/net |
VCC |
+3.3V bus/net |
VCC |
+3.3V bus/net |
+VE (red) |
GND |
-VE bus/net |
GND |
-VE bus/net |
GND |
-VE bus/net |
-VE (black) |
A5 |
SCL |
|||||
A4 |
SDA |
|||||
8 |
4.7K resistor |
+3.3V bus/net |
||||
8 |
Signal (yellow) |
|||||
11 |
MOSI |
|||||
12 |
MISO |
|||||
13 |
SCK |
|||||
4 |
CS |
|||||
Power supply |
||||||
18650 cell +4.2V |
Switch (blue) |
3.3V regulator '662K' |
+3.3V bus/net |
|||
LM6206N3 |
||||||
Arduino |
FTDI serial adapter |
|||||
GND |
GND |
|||||
GND |
CTS |
|||||
VCC |
VCC |
|||||
RX1 |
TX |
|||||
TX0 |
RX |
|||||
Teething troubles
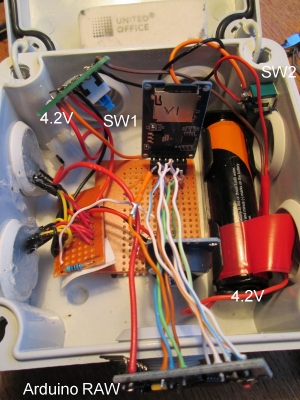
The monitor was shipped by post and did not save a file to the SD card on arrival, except when the Arduino was connected to a PC through the FTDI serial adapter.
Presumably due to vibration in the post the main wire from the battery (18650 cell, 4.2V) had detached and the real time clock terminals were loose. After correcting these problems as best as possible, the monitor still did not save a file to the SD card with the battery connected despite the fact that it gave 3.25V at all the appropriate points in the circuit, e.g. VCC on the cards. With the FTDI serial adapter connected, the voltage at VCC on the Arduino was 3.43V. Various options were tried. For example feeding 4.2V to 'RAW' on the Arduino and relying on the wire from VCC on the Arduino to supply power to the main board (see photo) resulted in only 3.25V throughout the circuit (VCCs), and no file was written to the SD card. But when the wire from VCC to the main board was cut, and, in addition to the 4.2V feed to Arduino RAW, an additional feed of 4.2V was given to the main board, the monitor wrote a file to the SD card.
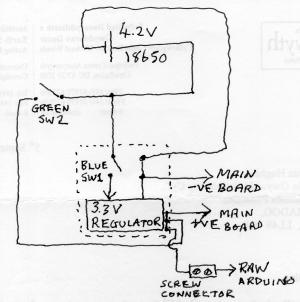
Revised power circuit
Sensor Calibration
Although the DS18B20 sensor specification says 'accuracy over the range of -10°C to +85°C: ±0.5°C' it seemed advisable to check them in the range of temperatures likely to be encountered, e.g. 0-40°C. The low temperature was checked by putting the sensors bound together with a rubber band in melting ice. Once the readings had stabilised the six sensors average readings over ten minutes were -0.25, 0.21, 0.15, -0.03, -0.10 & -0.30°C with an average for allof -0.05°C, i.e. well within specification. Some small peaks of about 0.5C appeared in three of the sensors data series as shown on the following chart.
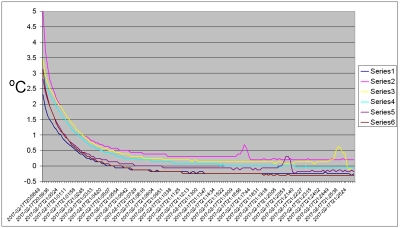
The explanation for those peaks is so far elusive. It seems unlikely to be voltage fluctuations as all six sensors had the same power source.
For the calibration at 40°C the sensors were placed in warm water in a well insulated container. They were again bound together and a clinical mercury-in-glass thermometer affixed to them. This thermometer recorded the maximum reading when the sensor temperatures recorded a plateau which lasted 2 minutes. Their average readings over that period were 39.44, 39.44, 39.44, 39.48, 39.50 & 39.31°C with an overall average of 39.43°C. The clinical thermometer recorded 39.75°C, which, assuming the latter is correct confirms that the sensors are within the ±0.5°C specification. This was further confirmed by a previously calibrated 0-50°C mercury-in-glass thermometer which showed 38.3°C at power off of the monitor, with the sensors showing 38.13, 38.19, 38.13, 38.19, 38.19 & 38.06°C with an average of 38.15°C.
Data storage and online visualisation
Data are stored in a CSV file on a micro SD card and the card is changed usually every few days up to a week. Initially the data were visualised using the line chart in Microsft Excel, but as this is cumbersome and does not allow the visitor to examine the whole data set in detail, the data were uploaded to emoncms.org (openenergymonitor.org) to take advantage of the horizontally scrollable multigraph visualisation facility there.
The RTC was set to show Greenwich Mean Time (GMT) throughout. To allow for daylight saving during the period of British Summer Time (26 March to 29 October 2017 inclusive) add one hour.
The data are uploaded to emoncms.org in a Windows XP cmd.exe
window using php.exe (last WinXP version 5.4.45) to call the file bulk.php downloaded from
https://raw.githubusercontent.com/Jodaille/DavidHeafHives/master/CsvToEmoncms/bulk.php
and edited with the correct APIkey and nodeID. For convenience of editing the command used
at cmd.exe, a BAT file with the command line is used. The command line has the form C:\PHP\php.exe bulk.php mydata.exe.
David Heaf
Email: david (at) dheaf (dot) plus (dot) com