Warré hive scale data (scale 1)
Design and construction of the scale are presented here. The scale records date, time, temperature and weight every three minutes on a micro SD card. The data are uploaded about weekly to an Emoncms host. The following visualisation of the data is provided by the multigraph option in Emoncms modules.How to use the multigraph visualisations
Hover the mouse pointer over the graph to reveal the control buttons top right. If necessary, scroll to the left using the '<' control button to find the end of the data. D=day, W=week, M=month, Y=year. +/- = zoom/shrink. <--> select period in data with calendar icons. Click tick to save. Point mouse pointer on any part of the curves to read the date/time and value. Dead straight lines in the data are mostly when the battery is removed for recharging, though sometimes due to failure to write to the memory card. Clicking on the data series names top left allows displaying just weight or just temperature.
Times are all GMT/UTC.
Comments on the multigraph data
This scale comprises a 200 kg single-point load-cell and Arduino-based data logger. Such cells are said to be subject to changes due to creep (drift) and temperature. This being so, this scale should be considered as still under development while these factors are being assessed. Thus absolute weight values and slow changes in weight are suspect until methods of correction are found. Results of a 5-day test of creep with a 25 kg weight are shown on this page.
17 Jan 2019: The step in weight of about 0.5 kg corresponds to an adjustment of the overload protection shims (spacers), one of which was restricting scale movement. Allowing for the step, the fall in weight between 13 and 20 Jan was about 0.6 kg. From the creep (drift) test shown here, much of that 0.6 kg might be accountable for by creep.
29-30 Jan: Hail settles on the roof, especially on the night of 30 Jan. Weight plateaus at 32.1kg but falls rapidly to 31.8 after 10.30h as the ice melts in the sun.
10 Feb: Approx. 700 g weight loss in one month. Peaks on the weight only multigraph are periods of rain.
10-17 Feb: Underlying rate of weight drop now steeper. 'Breakfast canyon' showing on sunny/warm days. Early afternoon sharp peaks on warm days 11, 14 & 15 Feb could be from water carriers or even from nectar foraging on early Prunus spp. flowering nearby.
17-24 Feb: General weight increase 19-21 Feb due to rainy periods. Hive maintaining its weight due to nectar and high pollen influx.
3-24 March: Rain most days made bee-related weight changes undetectable. Baseline weight in a dry period on 24 March 29.0 kg, down 3.1 kg from start weight of 32.1kg on 13 Jan.
24-31 March: Sunny, dry weather brought an upward trend in hive weight starting on 25 March. Willow still in flower, and Prunus species as well as dandelion flowering early. Intense foraging of most colonies in the apiary.
31 March-7 April: Third hive body box nadired, increasing the weight by 4.4 kg. 2-5 April weight loss due to cool weather and rain. 'Breakfast canyon' visible 5-7 April. Approx. 0.6 kg weight gains 1, 6, & 7 April.
8-21 April: Small weight gains up to 16 April with cool overcast days and cold night down to 3C. About 4 kg weight gain 17-21 April in unseasonally warm weather for this location.
21-28 April: Approx. 0.5 kg weight gains to 24.04, then storm 'Hannah' came with gusts recorded locally to 70 mph (112 kph). Noise on the trace on 26.04 attributable to wind rocking. The ~2kg transient weight loss at 11.23, probably due to a strong gust. 58 mph (93 kph) was recorded nearby about that time.
28 April-5 May: Anomalous 1 kg drop in weight on 28 April when re-tared after card change and battery recharge. Otherwise upward weight trend continues despite cool weather.
5-11 May: Weight readings very unstable: cause traced to an invasion of young earwigs (Forficula auricularia), cured by better sealing of the electronics chamber. Unseasonally cool until 10 May. Little weight gain.
12-24 May: A period of warm, sunny weather increased the hive weight to over 50kg.
24 May: step in the weight graph due to an extra hive body box (approx. 4.7kg) nadired under the existing three.
24 May-2 June: a week of cool, overcast and rainy weather resulted in over a kilo loss in weight.
2-9 June: Data not written to SD card for reasons unknown. Continued poor weather saw a drop in weight of about 2.5 kg.
9-14 June: Continued overall decline in weight in cool, wet weather.
14-22 June: Possible abortive swarm in early afternoon of 18 June. Swarm of about 1 kg at noon (GMT) on 19 June.
22-30 June: Weight increases totalling 4kg on 3 days with temperatures over 20C.
30 June-8 July: Losses late june made up by 3 July. 3-8 July data not written to SD card for reasons unknown.
8-14 July: Gains of up to 2kg a day when temperatures go above 20C. Gains in the first half of the week offset by an overall loss in the second half.
14-28 July: Gains on some days offset by losses on others, such that the weight of about 63kg on 14 July was about the same on 28th.
28 July-18 August: Steady overall loss of weight of about 0.27kg per day. Wind affecting the trace on many days.
28 August 12:24 h: Clearer board inserted under top box.
29 August 11:55 h: Top hox harvested and clearer board removed.
29 August-22 September: Slow overall loss of weight continues but occasional small weight gains on fine days.
22-29 September: Ivy flow well under way. Slight but steady increase in baseline weight, i.e. neglecting the peaks due to heavy rain.
17 December: Changed sketch in Arduino to store the tare offset in EEPROM in order to avoid having to tare manually every time the battery was changed. Sketch now as used with scale 2. The scale records 2 kg heavier than before the sketch change.
17 December-18 January: Further small decline in weight. Very few bees remaining. Colony deemed to have failed.
Beginning of February 2020: Scale 1 transferred to a 2-box Warré (W6) with a humidity monitor in a shallow eke on top of the quilt.
31 March 2020: Nadired 2 boxes under W6. Hive total weight now 44.8kg. Faulty recording of scale data through April 2020. Cured by end of month.
Graphs of selected sections of data
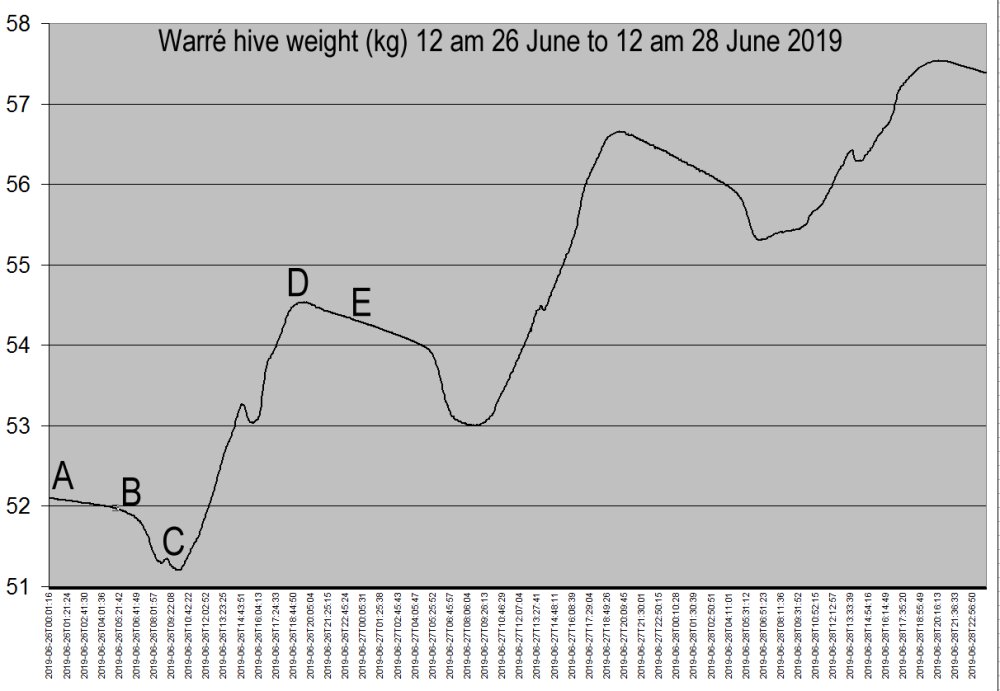
The following graph shows three consecutive full days when the foraging conditions were good. On a typical day, starting at midnight, the graph falls into four phases:
AB slow weight loss due to respiration by the cluster,
plus the tail end of nectar drying.
BC departure of the foragers ('breakfast canyon'); B is around 5 am on these
three days.
CD weight increase due to incoming nectar; D is around 8 pm on these three days.
DE slow weight loss due to nectar drying and respiration by the cluster.
Mid afternoon on each day is a 'kink' on the CD phase of the graph. This is attributed to the daily mass orientation flight, which often involves many drones.

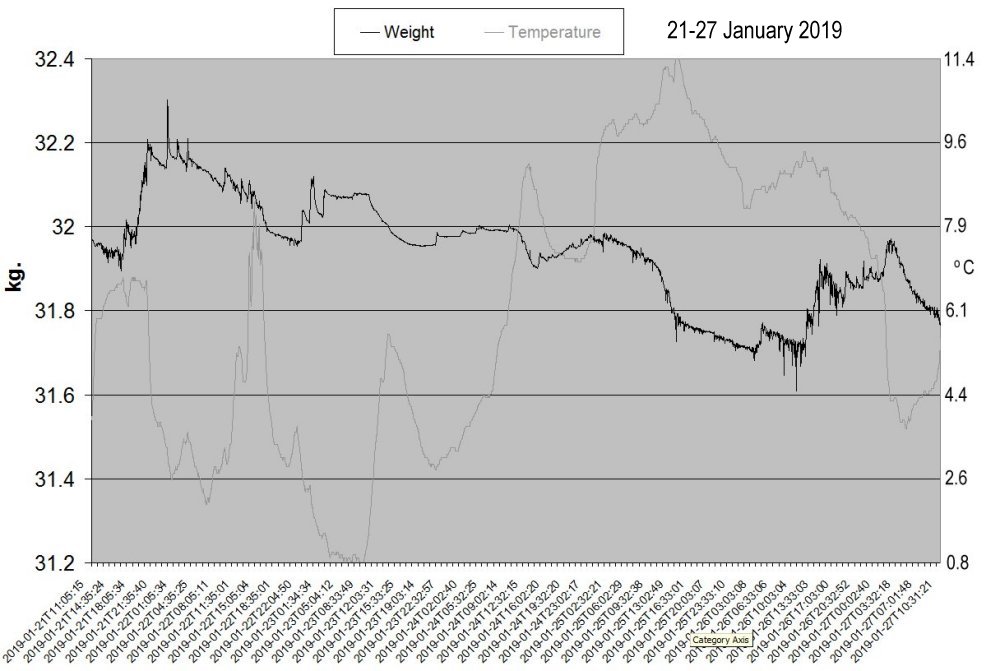
The following graph has the weight scale (Y-axis) greatly expanded to exaggerate small changes. Firstly we see a downward trend in weight over the week of about 0.35 kg. Some of this could be attributable to creep inherent in the load cell. Secondly, linear trend analysis shows an inverse correlation between weight and temperature. However, as temperature shows an upward trend of about 5ºC during the period, and weight a downward trend, the apparent correlation between weight and temperature may be spurious. Thirdly, parts of the weight graph are relatively 'noisy'. That this is unlikely to be due to electronic noise in the system is evidenced by smooth parts of the curve. These parts on 23-24 January correspond to a periods of almost no wind. Apart from appreciable numbers of bees entering or leaving the hive, the main factors that could cause short-term changes in weight are precipitation and wind. Inspecting data of the nearest Wunderground weather station, approximately 3.75 km from the hive, strongly suggests that the broader peaks on the graph are due to wetting of the hive, especially its flat roof, by precipitation. The narrower peaks could be due to wind pressure or changes in precipitation rate.

Data acquisition, processing, uploading and visualisation
An Arduino Uno logs the weight and ambient temperature to a micro-SD card every 3 minutes in CSV format. The CSV file is processed in MS Excel to convert the weight to kg so as to be presentable on the same scale as the ambient temperature. Due to a bug in the visualisation software which puts a peak wherever zero temperatures are recorded, any zero values are changed in Excel to 0.01 degrees. The CSV file is uploaded with PHP and appropriate script to a Linux web server already equipped with Emoncms (and its data visualisation modules), Apache (webserver), PHP and MySql (database). Once Inputs and Feeds are created in Emoncms, a suitable visualisation option is chosen and formatted, in this case Multigraph.
Acknowledgements
I thank Jody Noury (jodaille.org) for web hosting the data and Emoncms visualisation for this project and generously providing support.
Thanks are also due to the developers of Emoncms, more about which can be found here.
Contact: david (at) dheaf (dot) plus (dot) com