Warré hive humidity monitoring
Introduction
There has long been interest in whether honey bees control humidity in their nest, but investigaing it has been limited by the large size of the available apparatus (1). However, more recently and with the help of electronics, much smaller sensors have become available. Probably the neatest solution is the iButton which combines sensor and datalogger in a very small 'button'. iButtons were used by Eouzan et al. (2018) in their thorough study of Dadant hive humidity in four very different localities over a whole year, which showed that in-hive humidity was very stable and did not correlate with ambient humidity(2).
As this author considers iButtons unaffordable he chose to use DHT22 humidity temperature sensors wired to an external datalogger. This page describes a datalogger monitor with four sensors for relative humidity and temperature installed in a Warré hive. The colony chosen has 6 kg stores, and on warmer sunny winter days is the most active of the colonies in the apiary of 7 colonies.
Construction and installation
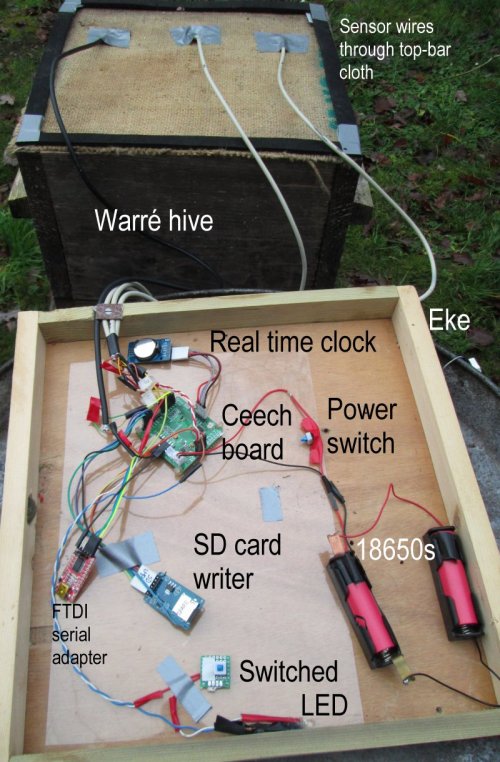
The monitor is based on a Ceech Astri Arista (Arduino Pro Mini) board with a real time clock (set to UTC (GMT)), micro SD card writer/reader, two 18650 4.2V batteries in parallel, and four DHT22 relative humidity and temperature sensors.
A fuller account of the equipment is here with the exception that a LED was connected to digital pin 5 through a 1K resistor and the sketch set to light it briefly when data are saved to the SD card reader/writer.
This board has an option for charging a 18650 4.2V battery with a 6V solar panel but this functionality was lost in a previous application due to water penetration. The batteries last for at least a week with SD card writing at 2 minute intervals, so is normally changed on a weekly basis at the same time as the SD card.
The monitor was housed in a 30 mm deep eke seated on the quilt and immediately under the roof. The eaves of the standard Warré roof were extended downwards by 40 mm to prevent rain penetration at the quilt to top box junction.
Three sensors are positioned 50 mm from the front wall and 100 mm deep in the top box of a 2-box colony as shown in the following photo. The middle sensor is in the middle inter-comb bee seam, and the others in the outermost inter-comb bee seams. The positioning towards the front was to ease installation as there is more honeycomb further back where the inter-comb space is consequently narrower. A 4 mm thick gasket of foam neoprene is placed on the hive box to accomodate the wires and improve the seal between it and the standard Warré quilt box that rests on it. The fourth sensor for monitoring ambient humidity hangs from the quilt in the gap between quilt and roof.
The sketch used in the Ceech board was adapted from https://randomnerdtutorials.com/arduino-temperature-data-logger-with-sd-card-module/ and uses Adafruit DHT Unified library https://github.com/adafruit/DHT-sensor-library . The sensors were wired to digital pins 2, 3, 6 & 7.
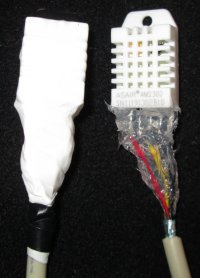
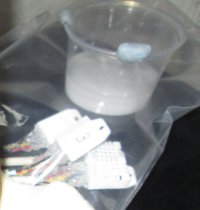
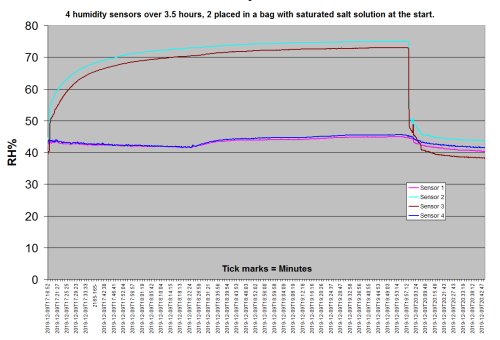
The soldered connections to the sensors were coated in silicone sealant. Consideration was given to protecting the sensors from propolisation by the bees. As PTFE tape is permeable to water vapour, the sensors were wrapped in it before implantation. The sensors were calibrated by placing in a plastic bag containing a beaker with saturated sodium chloride solution which gives an air moisture content of 75% RH. Sensors differed from each other by up to 4% RH.
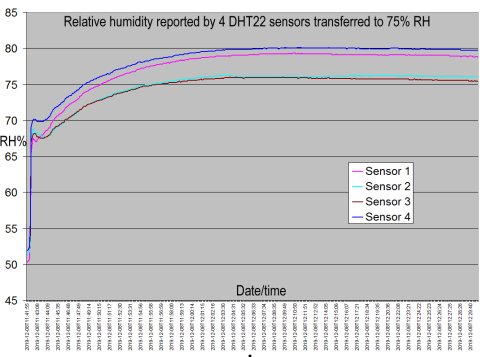
In order to test the effect of the PTFE wrapping, one wrapped and one unwrapped sensor were transferred to 75% RH. Paradoxically, the wrapped sensor (turquoise line in the image below) showed a faster response to the change from ambient RH (~45%) than the unwrapped sensor (brown line).
Of the 4 sensors purchased at the same time, one (No. 3) returned 'nan' (not a number) about 6% of reads. Rather than install a replacement, this sensor was used for monitoring ambient humidity. This meant that the missing data had to be replaced with immediately preceding values.
Results
The monitor was installed in the chosen hive on 21 December 2019. Data from the first 19 hours of its operation are shown in the graph below. The colony was obviously disturbed by the insertion of the sensors and took about 5 hours to stabilise humidity around 60%. The later fall in relative humidity at 'RH1', representing the right-hand sensor viewed from the hive front, and the rise at the other sensors, could mean activity in the cluster at dawn as light enters the hive.
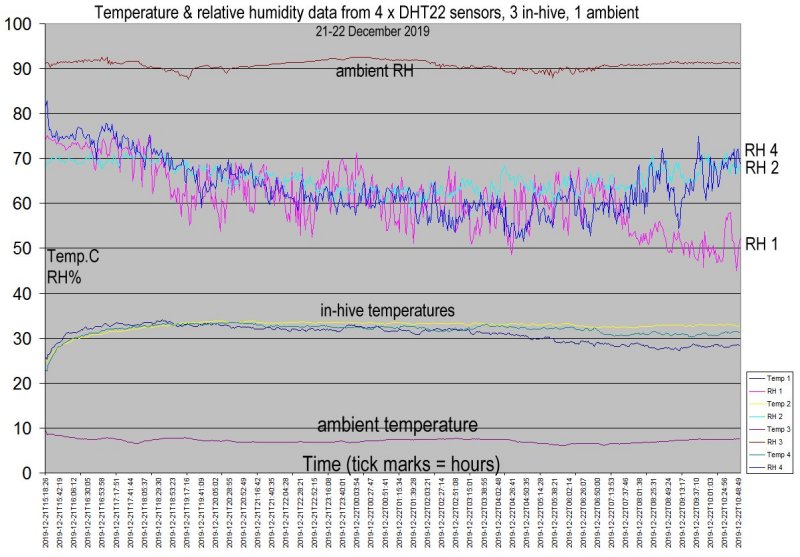
Eouzan et al. (2) reported an overall average winter RH value of 60% (range 25-100%) for three similarly positioned in-hive sensors at the four geographic locations of their study. Their winter average ambient RH ranged from 87-97%.
The above in-hive humidity traces are obviously 'noisy', showing very short-term fluctuations of about 15%. Sachs & Tautz (2017) reported similar fluctuations and attributed them to bee fanning activity near the sensors (3). They sampled data at hourly intervals, thus could not show the kind of short-term changes reported here, based on sampling every 2 minutes.
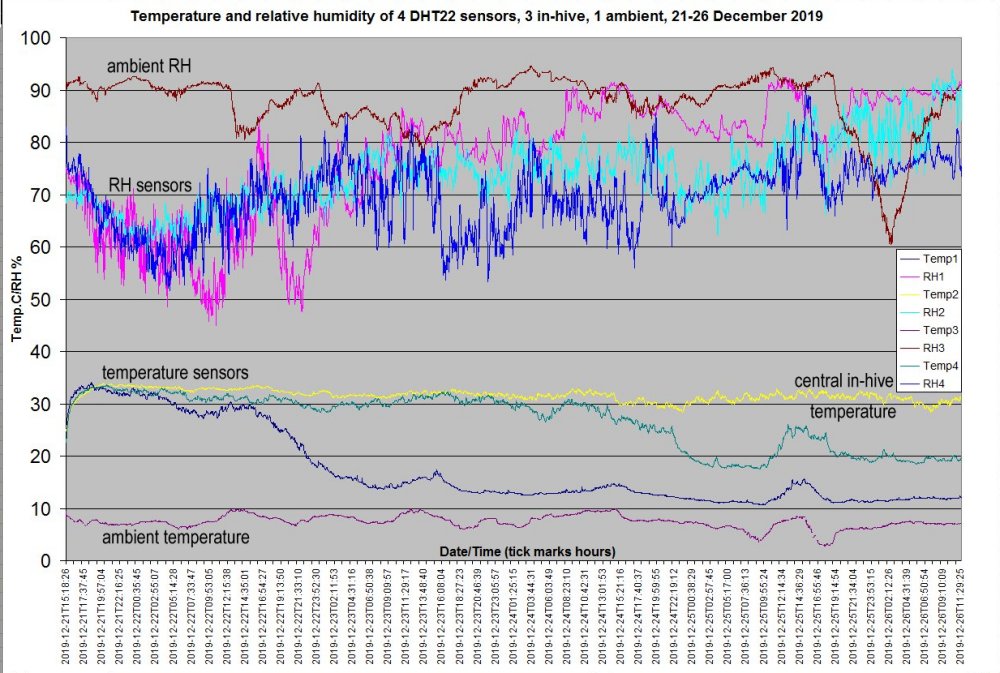
The following chart shows changes over 5 days. The steep drop of 30% in ambient humidity from the evening of 25 December to the following morning is mirrored in the data of a nearby personal weather station. Note that there is no similar drop in in-hive humidities during that time. The wide departure of sensor 1's RH trace (pink) from the other two on the morning of 22 December is maintained throughout the rest of the period. This is not surprising as the temperature at this sensor (dark blue) steadily drops close to ambient, indicating that the cluster has moved out of the inter-comb seam containing sensor 1. Further evidence of this is that the RH trace rises towards ambient RH and becomes less jagged, i.e. less influenced by fanning bees.
The corresponding seam on the opposite side of the hive shows a smaller drop in temperature (Temp4, green), and the humidity stays mostly below 80% (RH4, blue), indicating that some of the cluster remained in this seam.
The central temperature sensor (Temp2, yellow) shows a very steady trace in the low 30s (degrees C) throught the period. The corresponding RH (RH2, turquoise) mostly stays between 60 and 80% until midday on 25 December when it is in the 80-90% range. This corresponds to a peak in ambient temperatue, reflected in the in-hive temperatures of the outer inter-bee seams, and brought about by a period of several hours of completely clear skies through the afternoon.
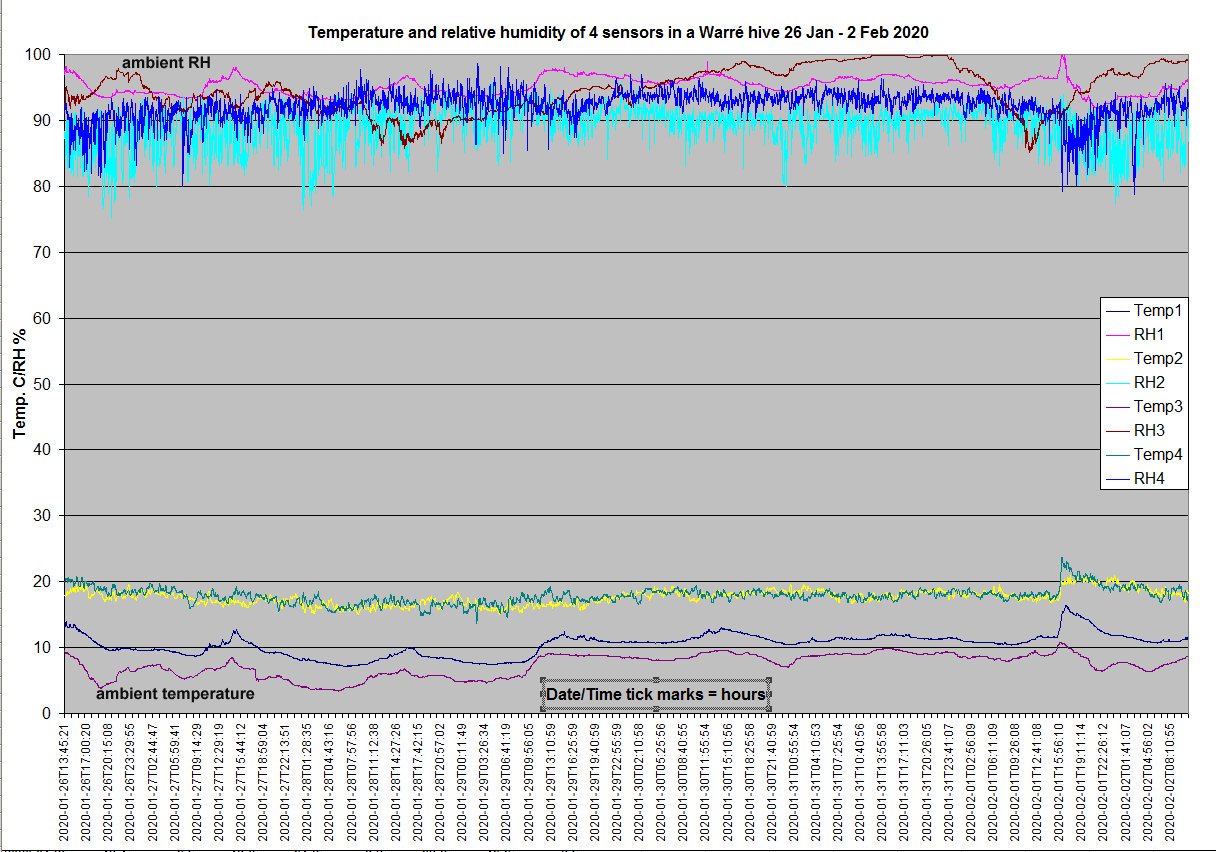
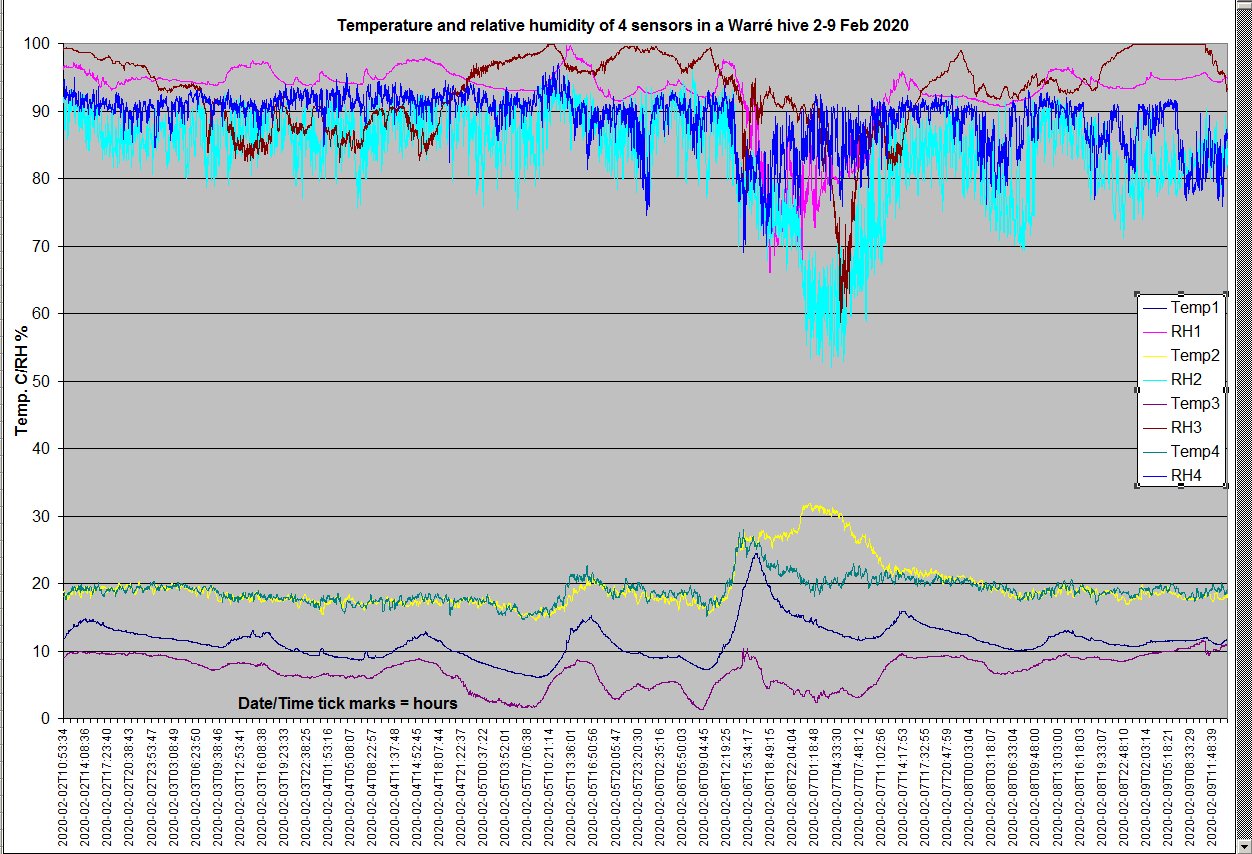
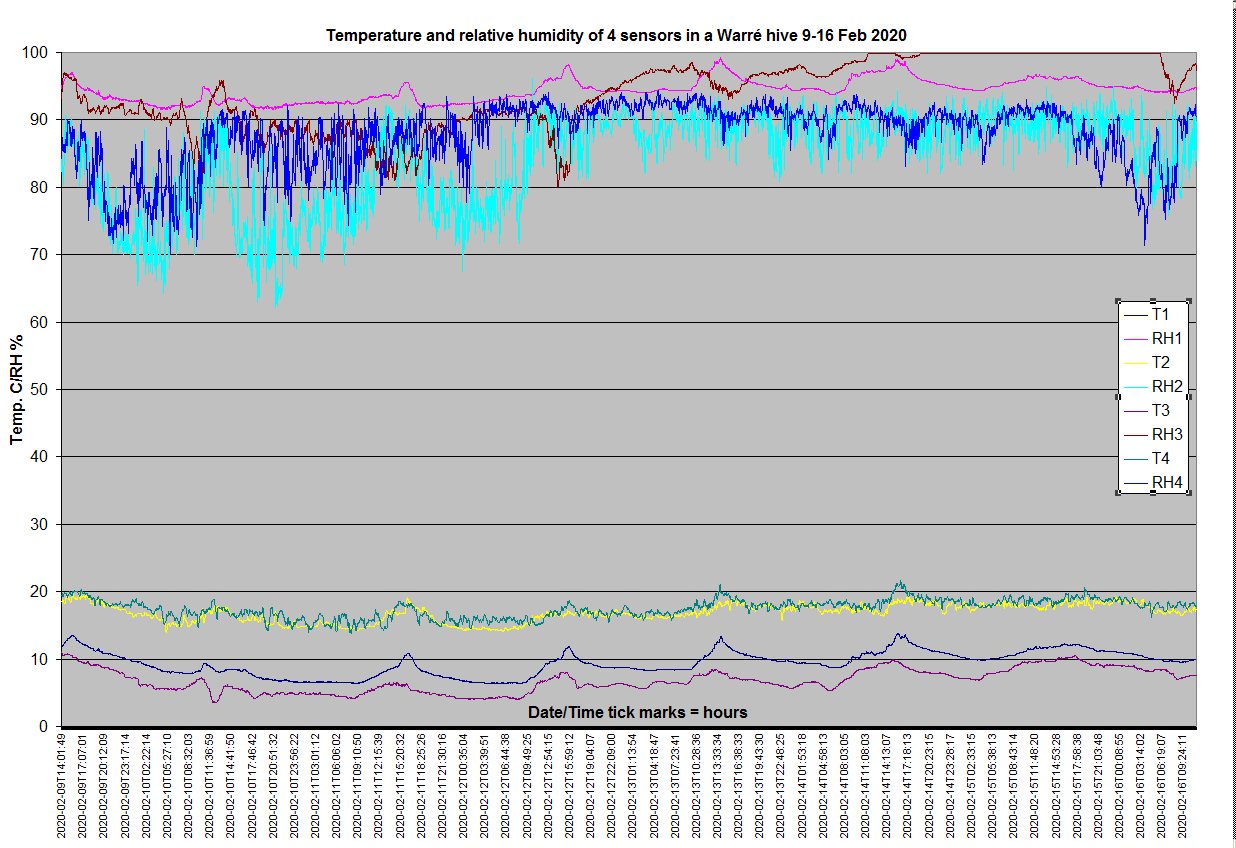
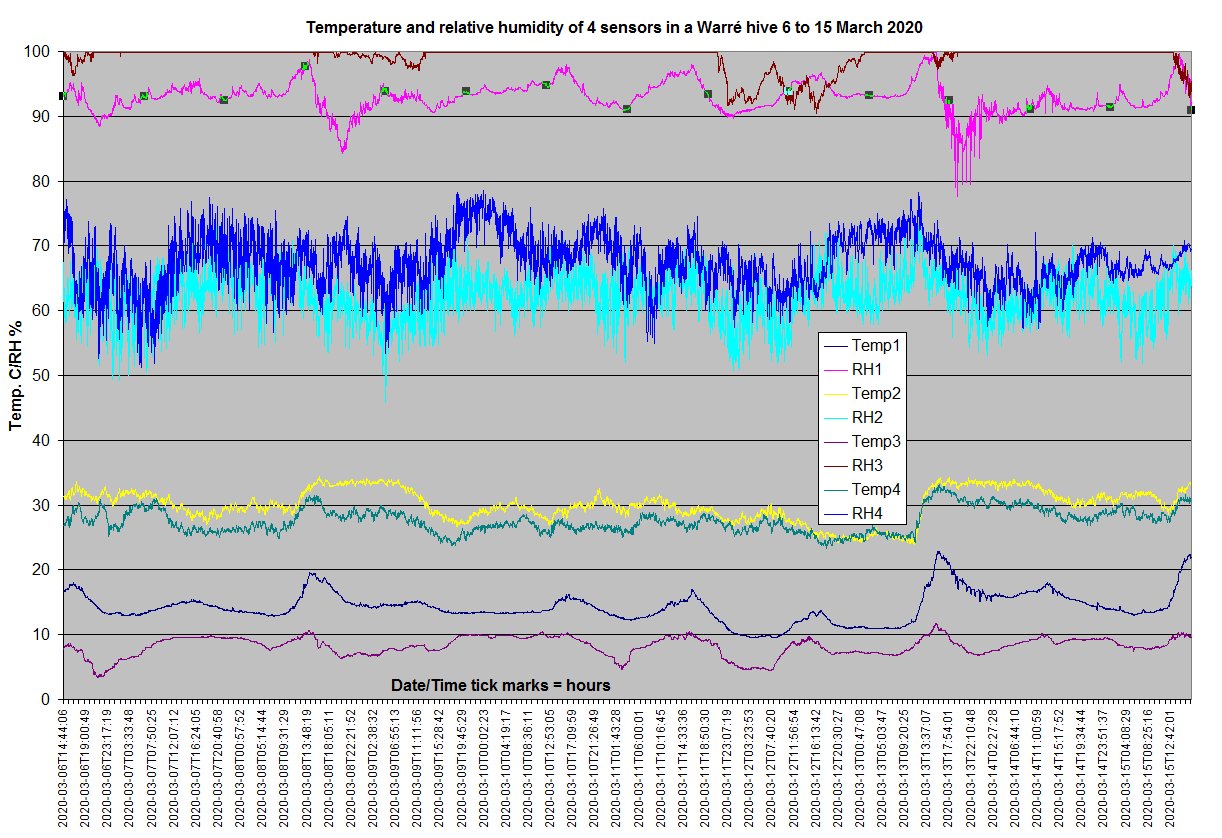
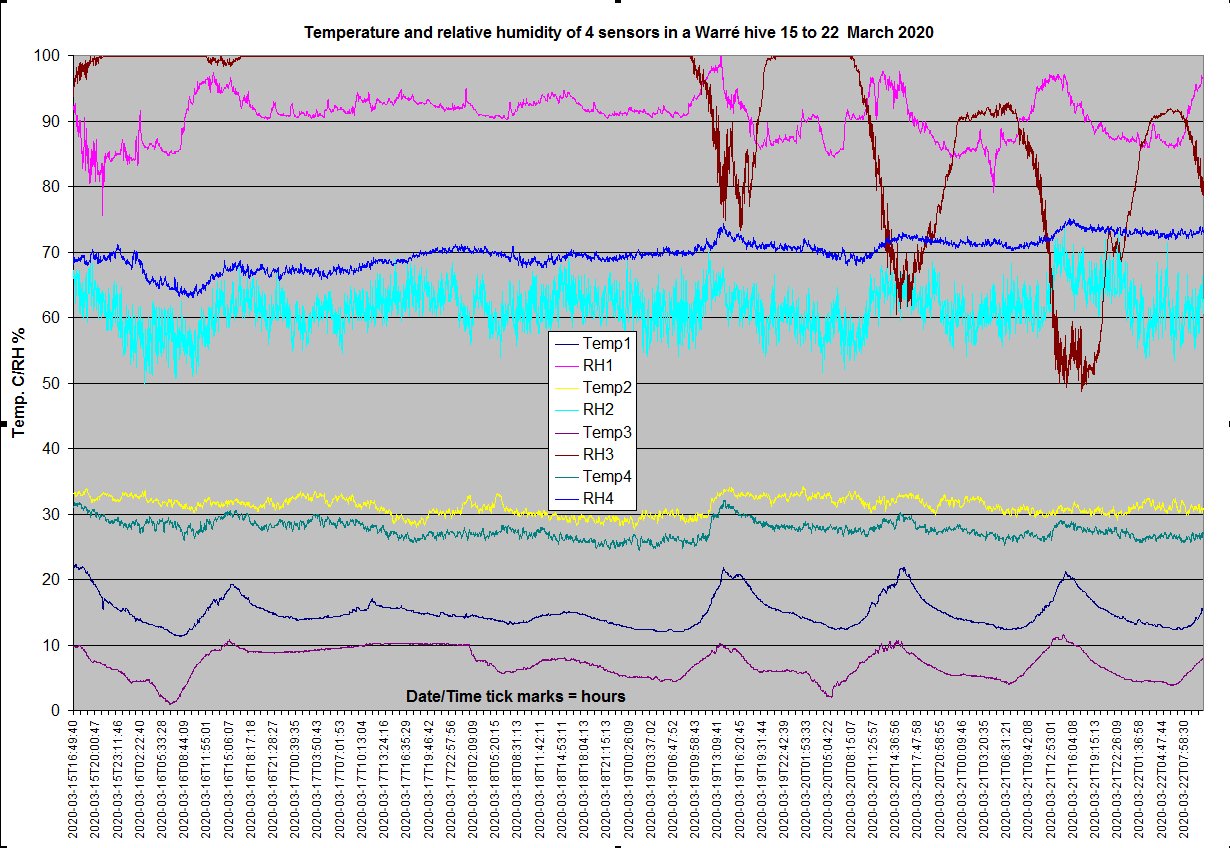
Weekly temperature and humidity charts
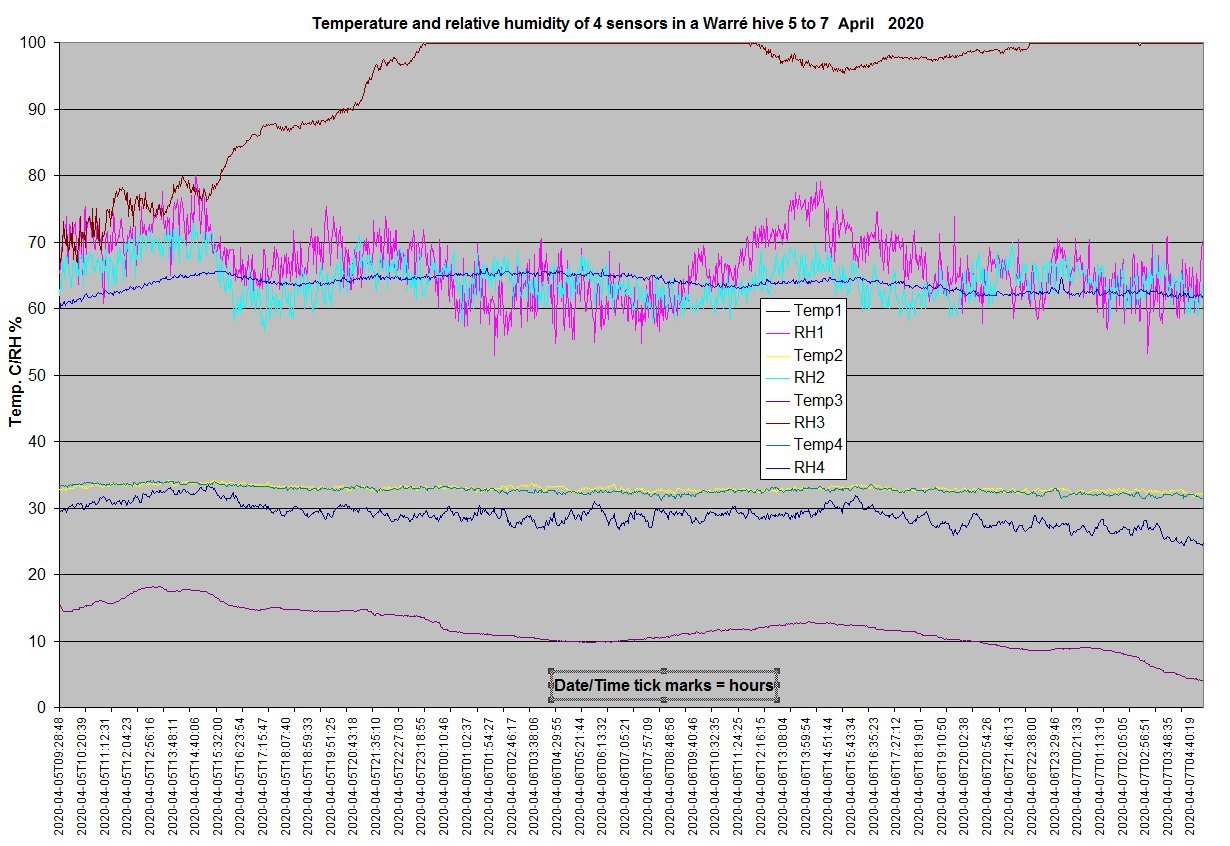
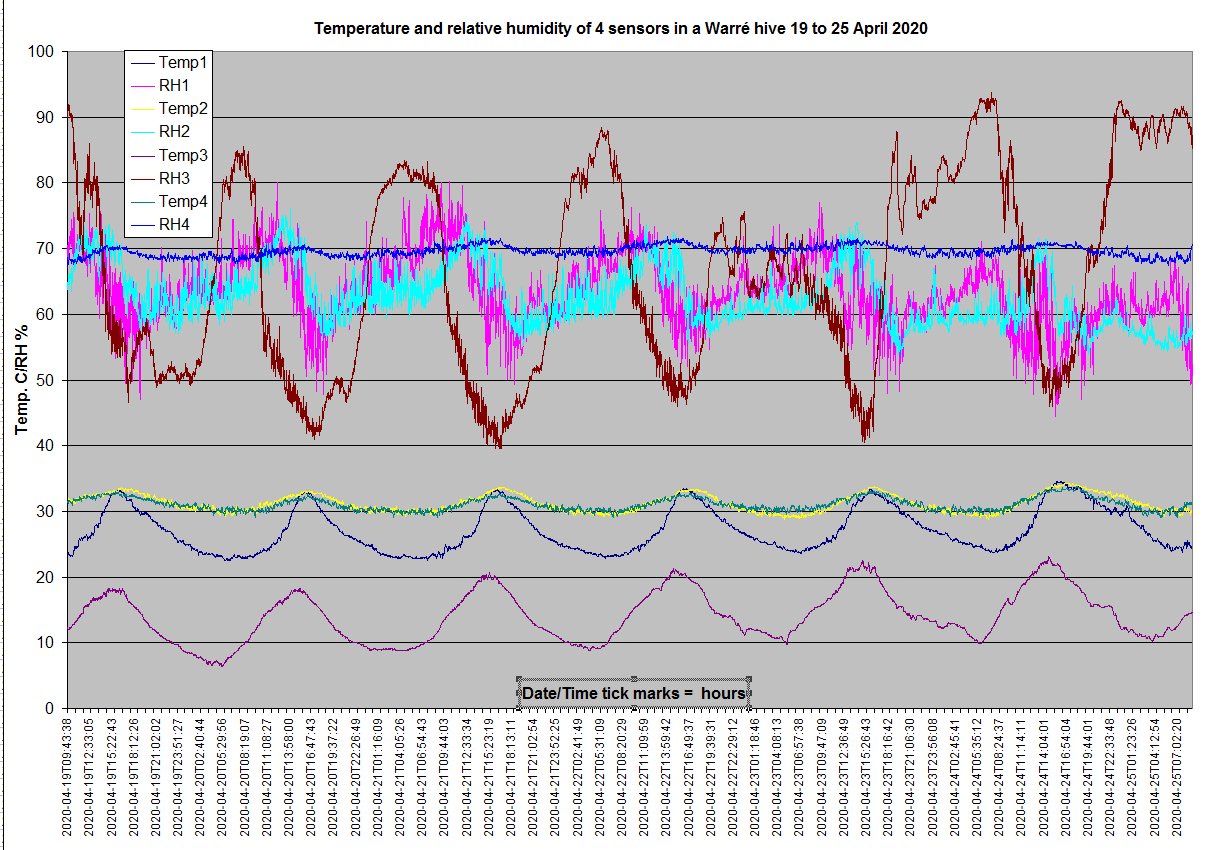
humidity_05-070420.jpg Failed to record 8-12 April 2020
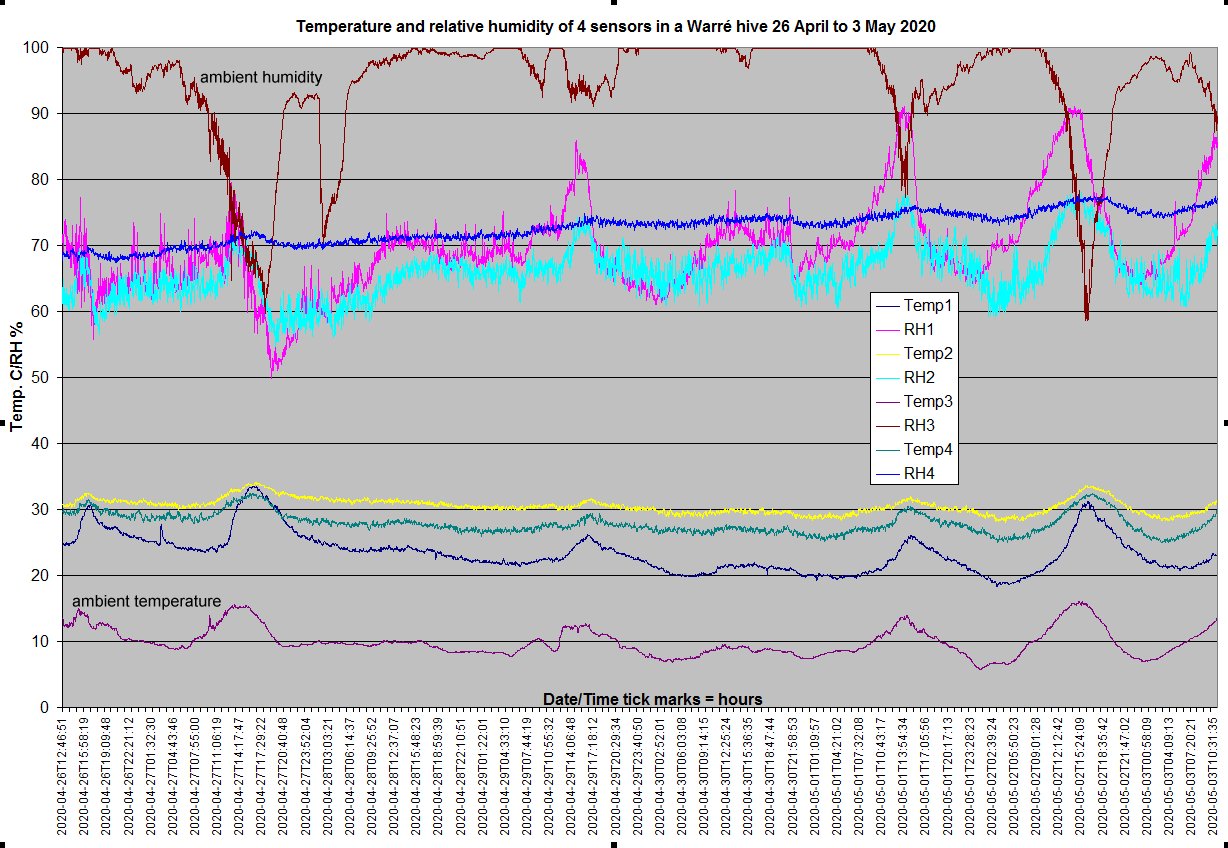
humidity_2604-030520.jpg Temperature sensors (in box 1) are well below normal brood temperature. The brood is probably in box 2.
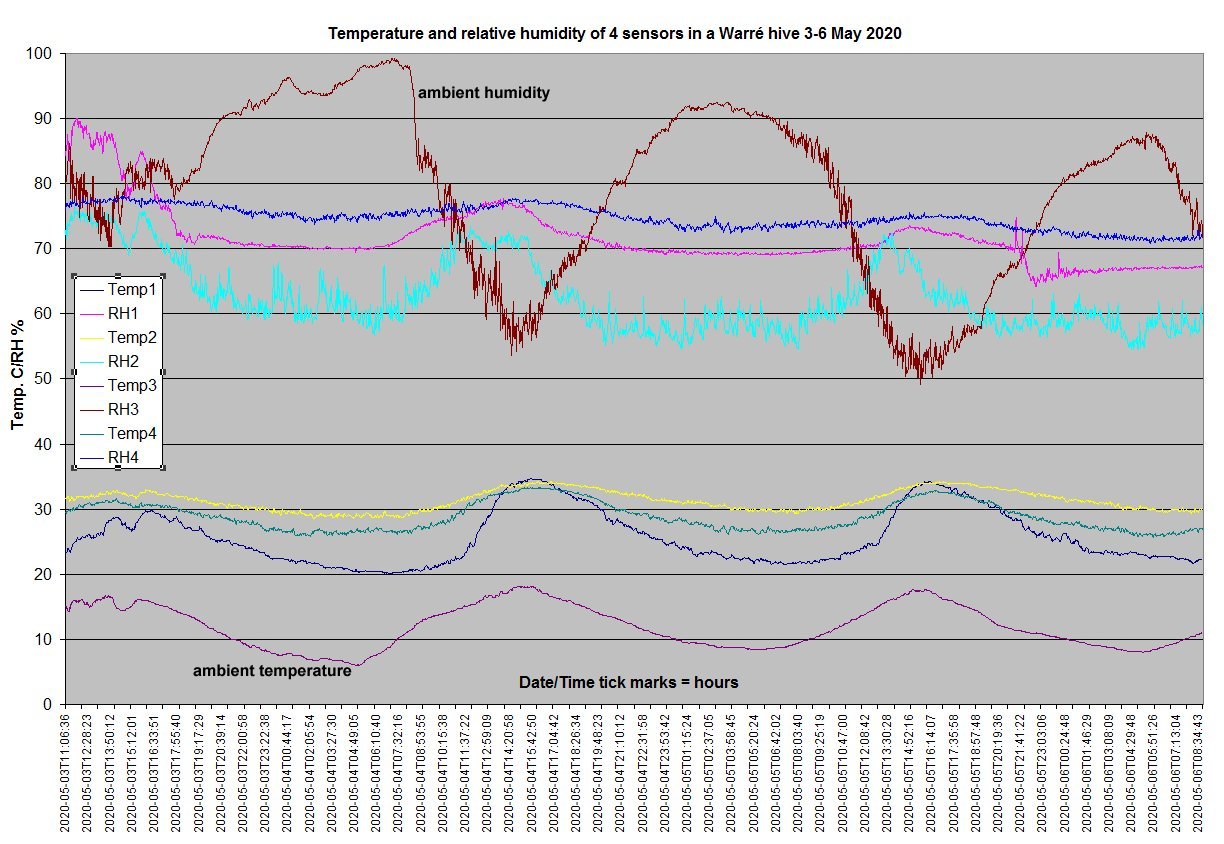
humidity_03-060520.jpg Failed to record 6-10 May 2020. Note much lower than usual ambient humidity.
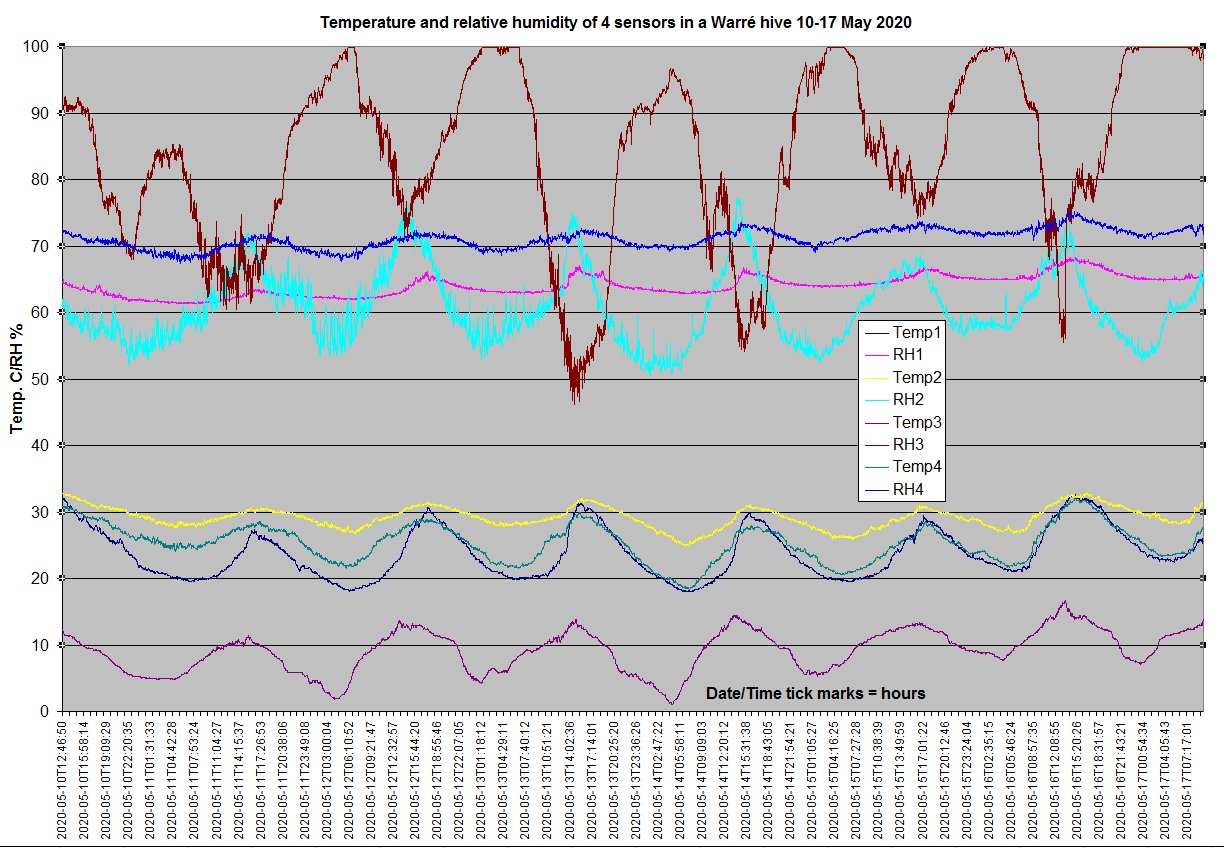
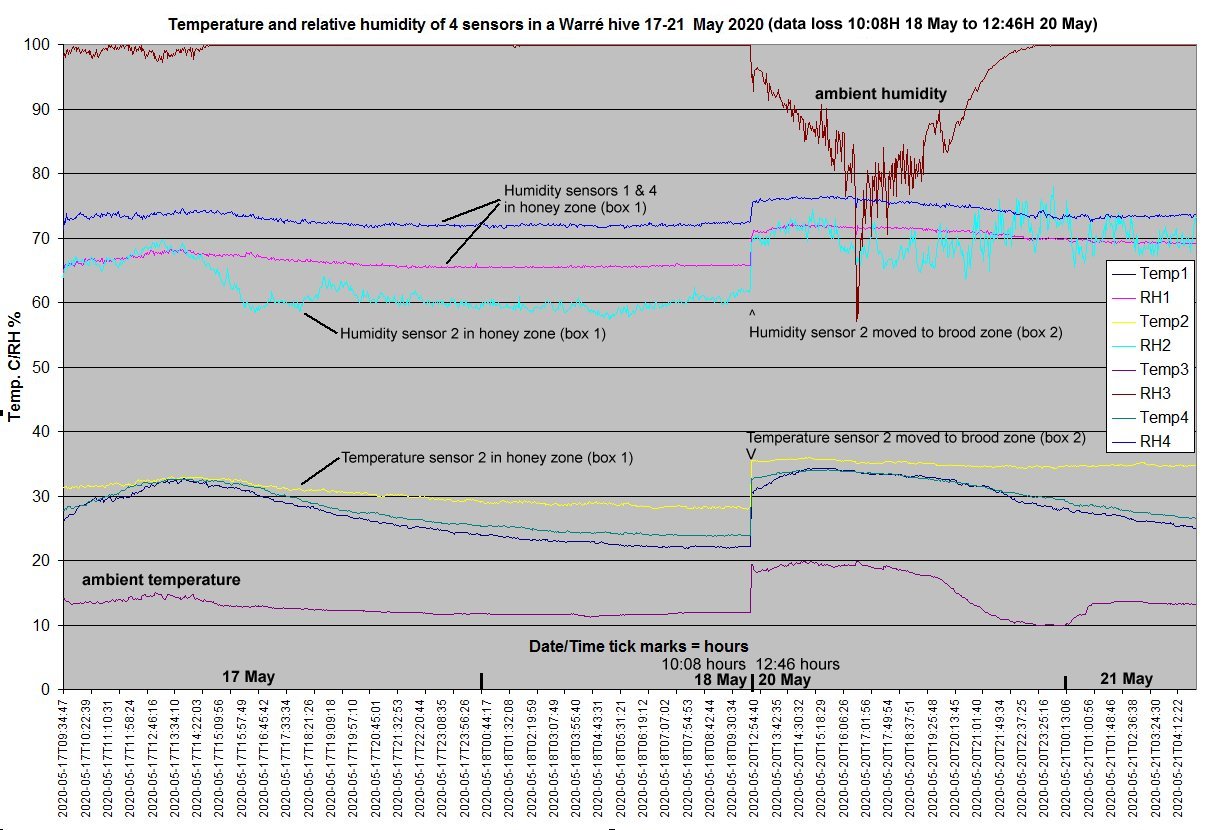
humidity_17-210520.jpg Sensor 2 moved down into brood zone of box 2 on 20 May, hence the jump in the graphs. Recording failure 18-20 May. Note that with sensor 2 now in the brood zone the temperature recorded remains steady, wheras sensors 1 & 4 remaining in the honey zone of box 1 are somewhat affected by ambient temperature.
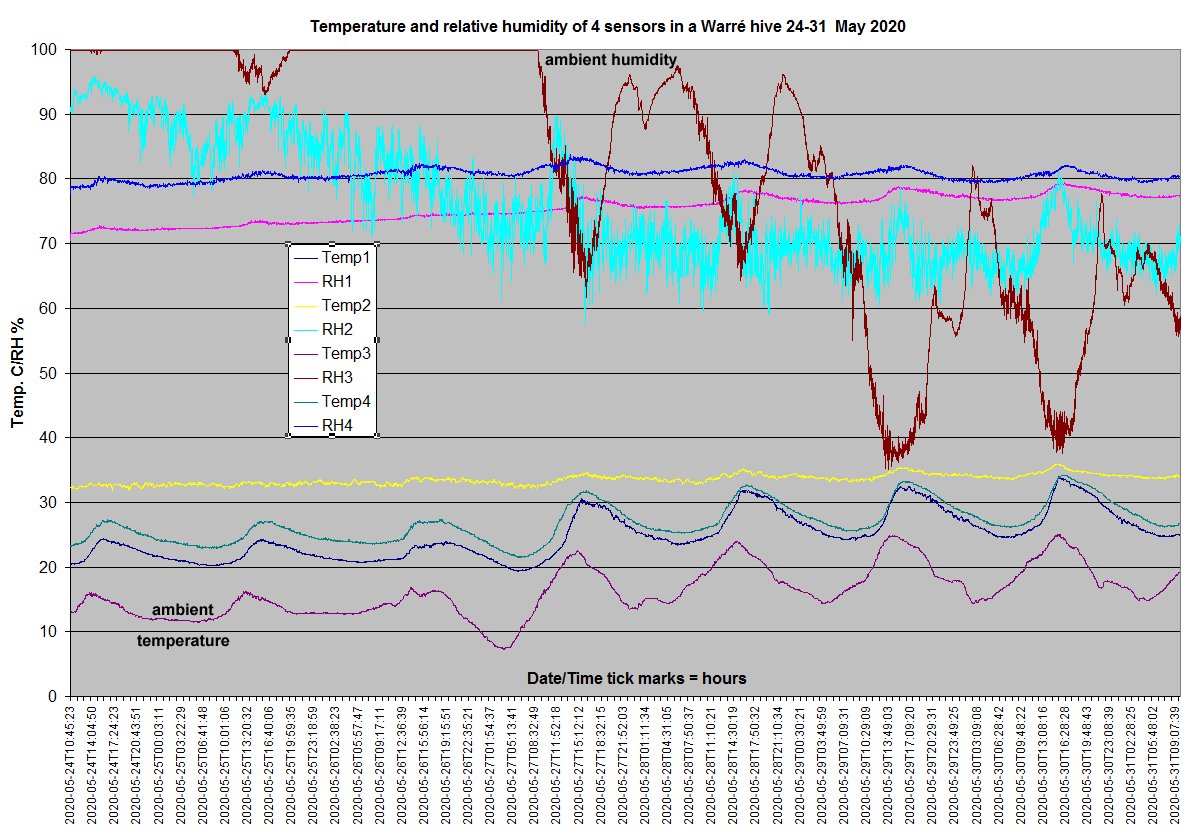
humidity_24-310520.jpg Ambient humidity fell below 40% while humidity in box 2 stayed in the 60-80% range.
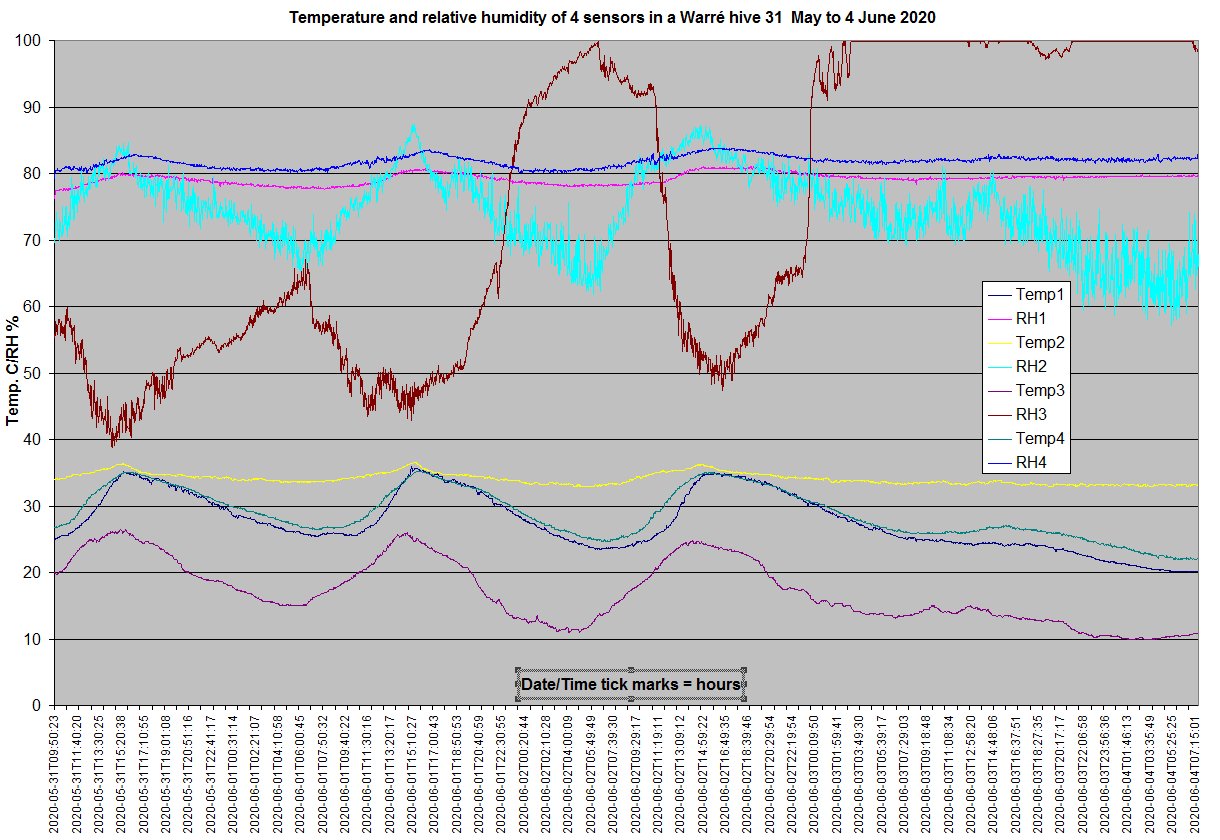
humidity_3105-040620.jpg Abrupt change in weather: ambient RH rose from 40% to 100%. Failed to record 5-7 May.
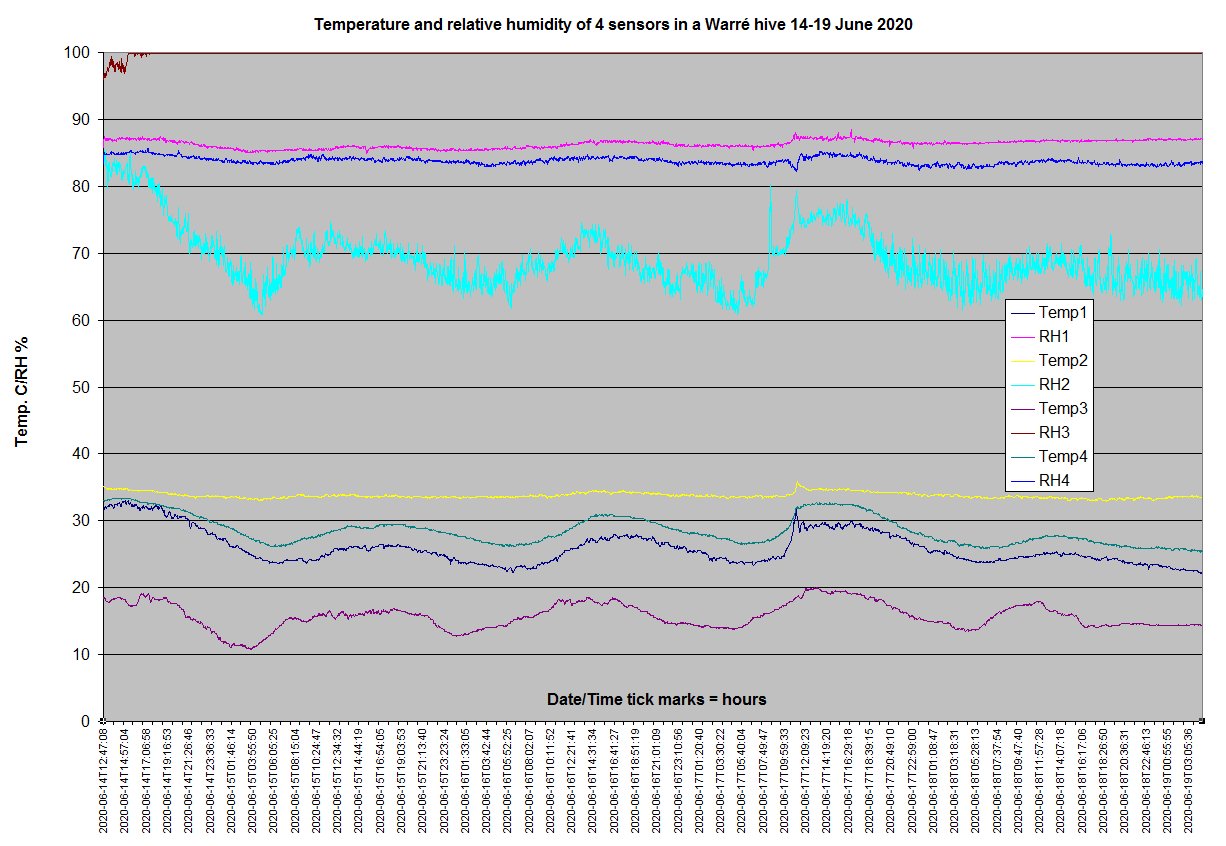
humidity_14-190620.jpg A peak in temperature at 11.27 hours GMT (12.27 BST) on 17 June suggests a swarm may have issued. The rise is 1.5 degrees at the brood sensor, smaller at the two others. There were also perturbations in the humidity traces around this time.
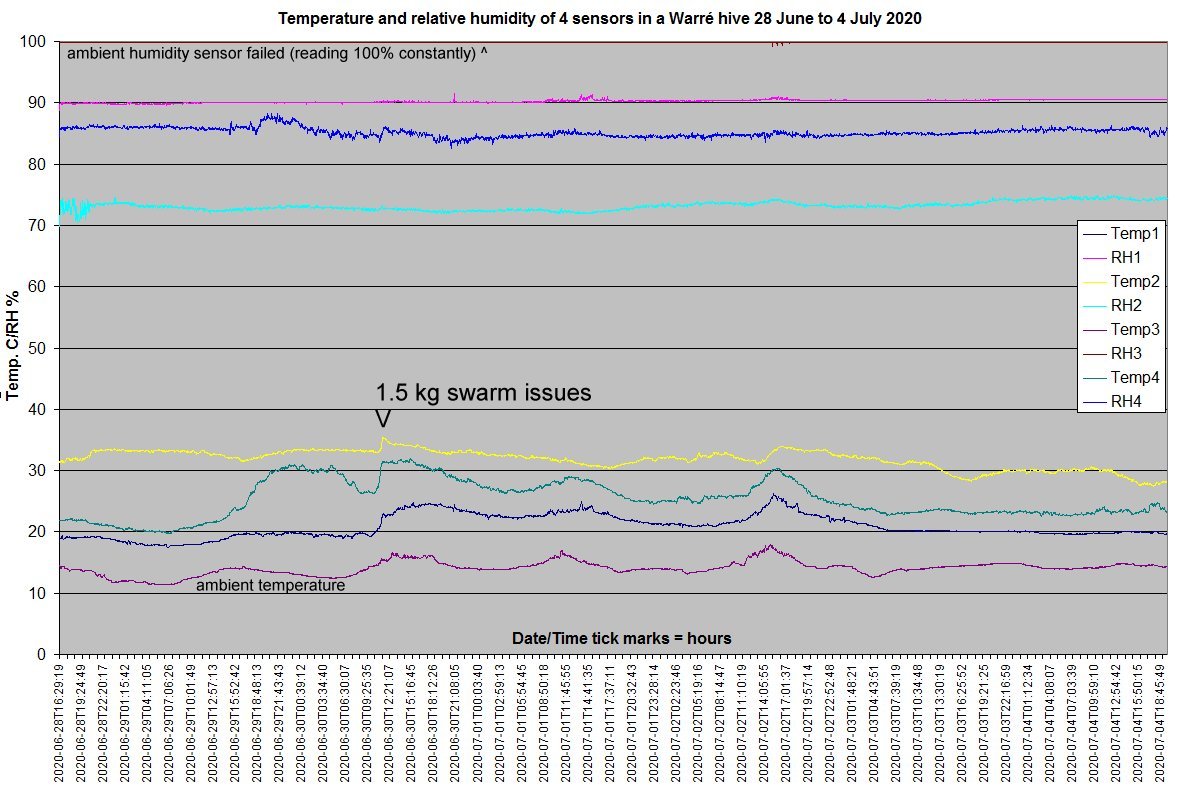
humidity_2806-040720.jpg A 1.5 kg swarm issued around 11.10 hours GMT on Tuesday 7 July. The event shows as a small peak on the temperature graphs. The ambient humidity sensor outside the hive appears to have failed.
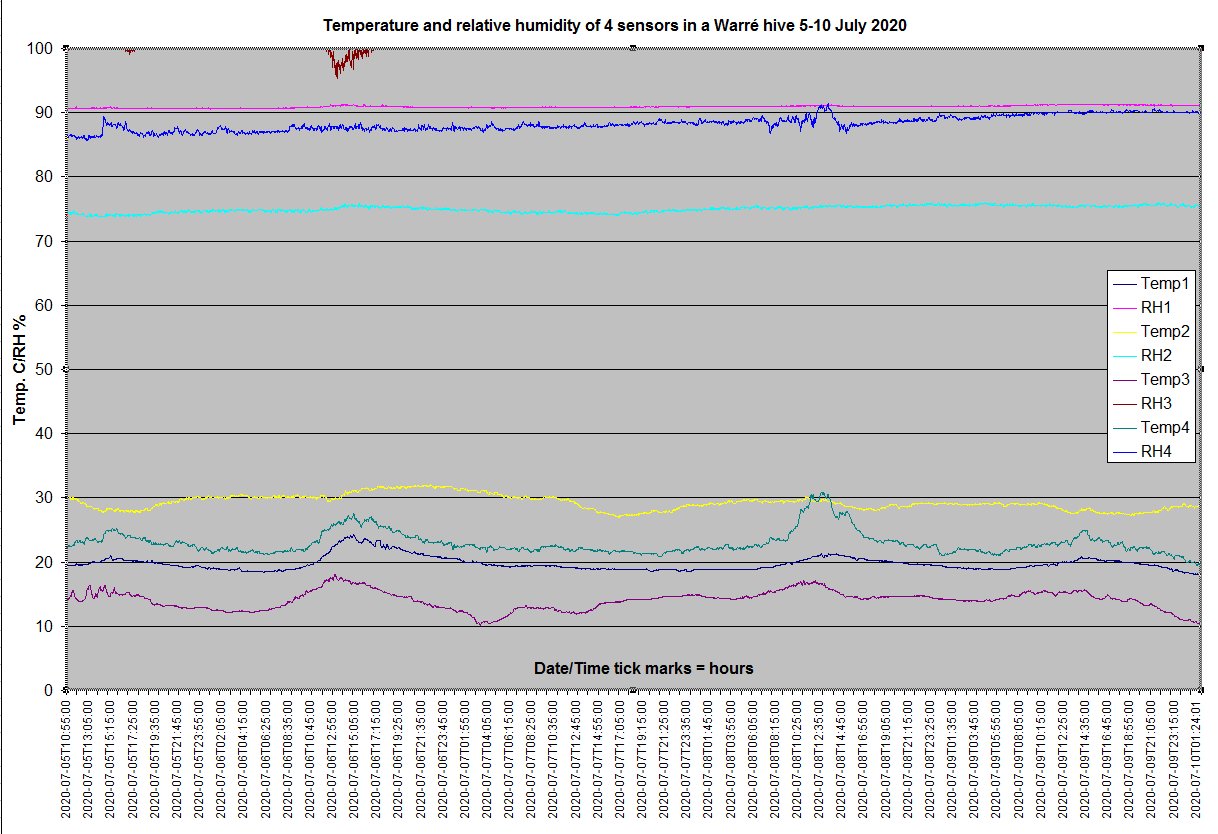
humidity_05-100720.jpg Following swarm issue the previous week the sensor in box 2 is showing temperatures below 30C, suggesting that brood rearing is tailing off. Battery failed mid-week.
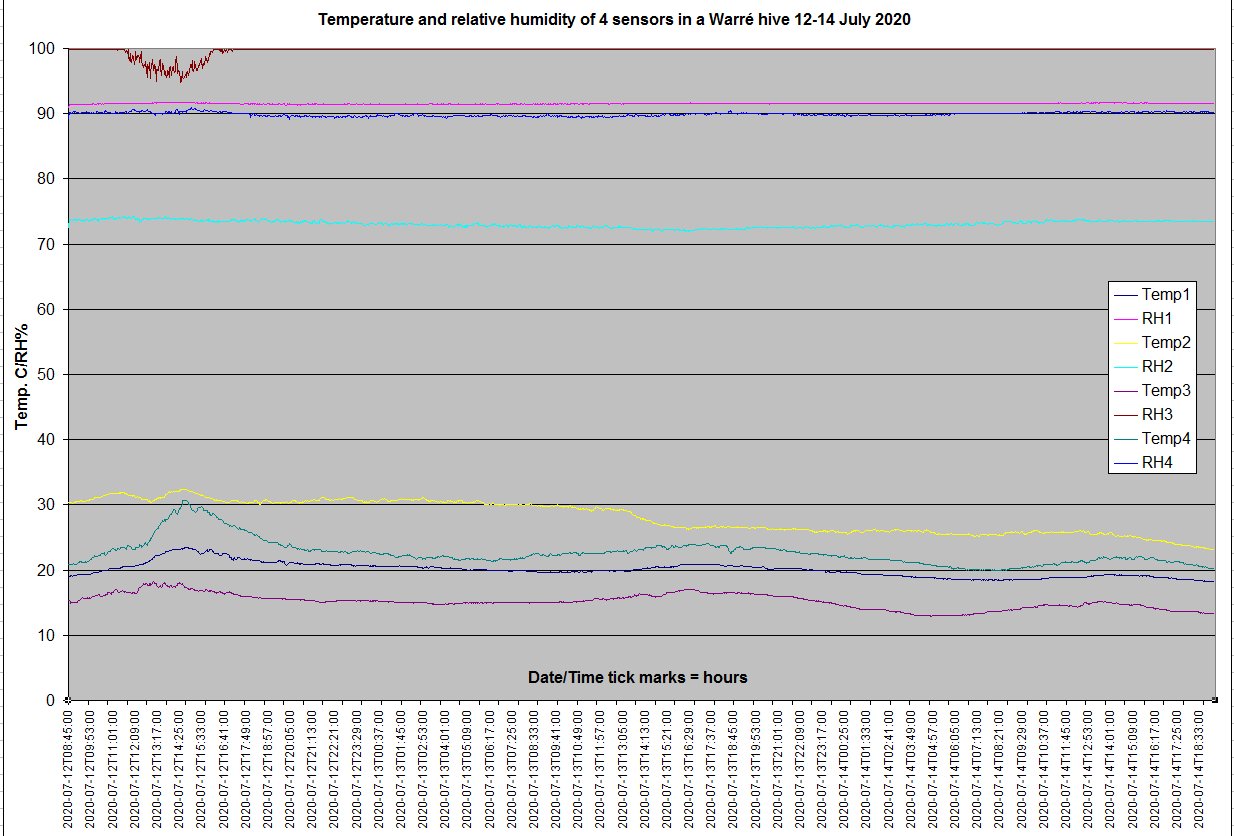
humidity_12-140720.jpg Clock data not recording. 2-minute readings inserted manually. Battery failed mid-week.
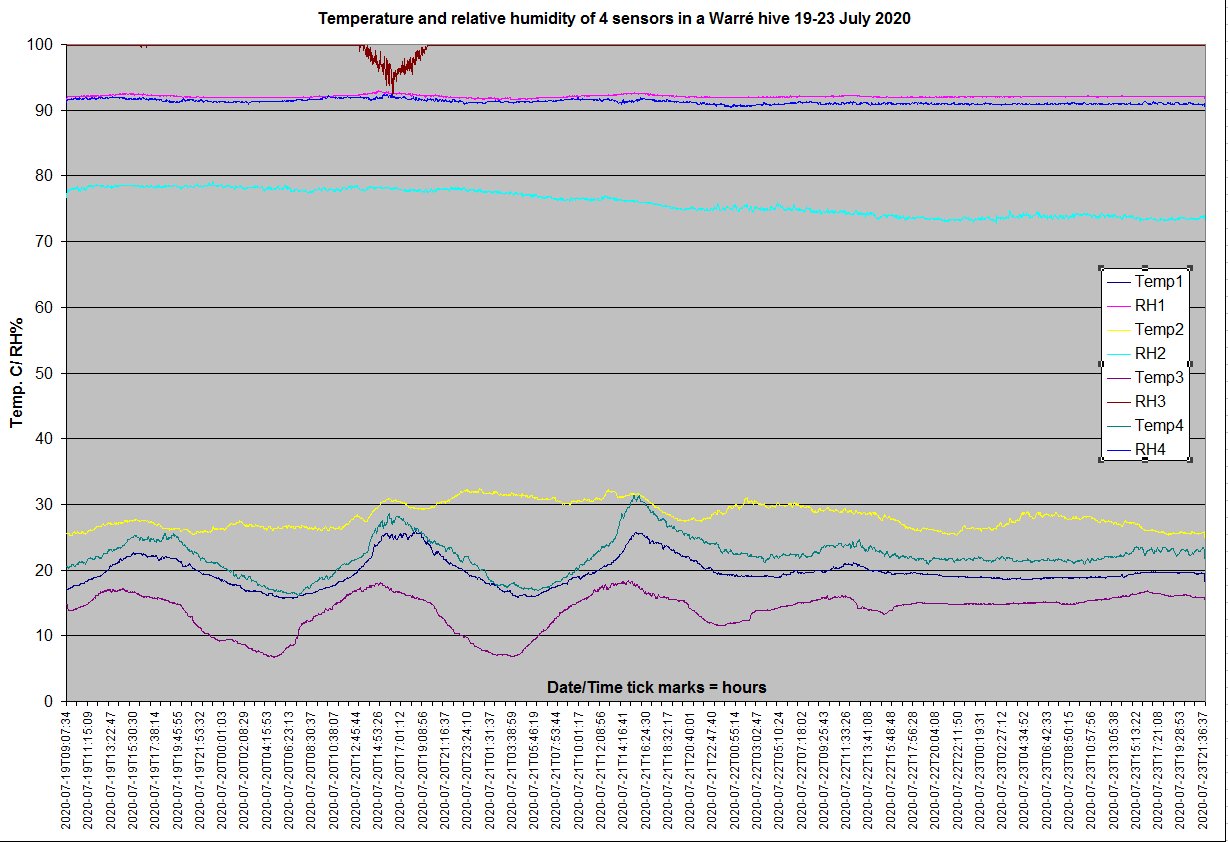
humidity_19-260720.jpg Battery failed mid-week. Sensor in box 2 (yellow) showing well below brood temperature.
humidity_19-260720.jpg Battery failed mid week: one of the two 18650s not making contact. Hive cooling considerably. Plenty of entrance traffic on 30 July; pollen coming in.
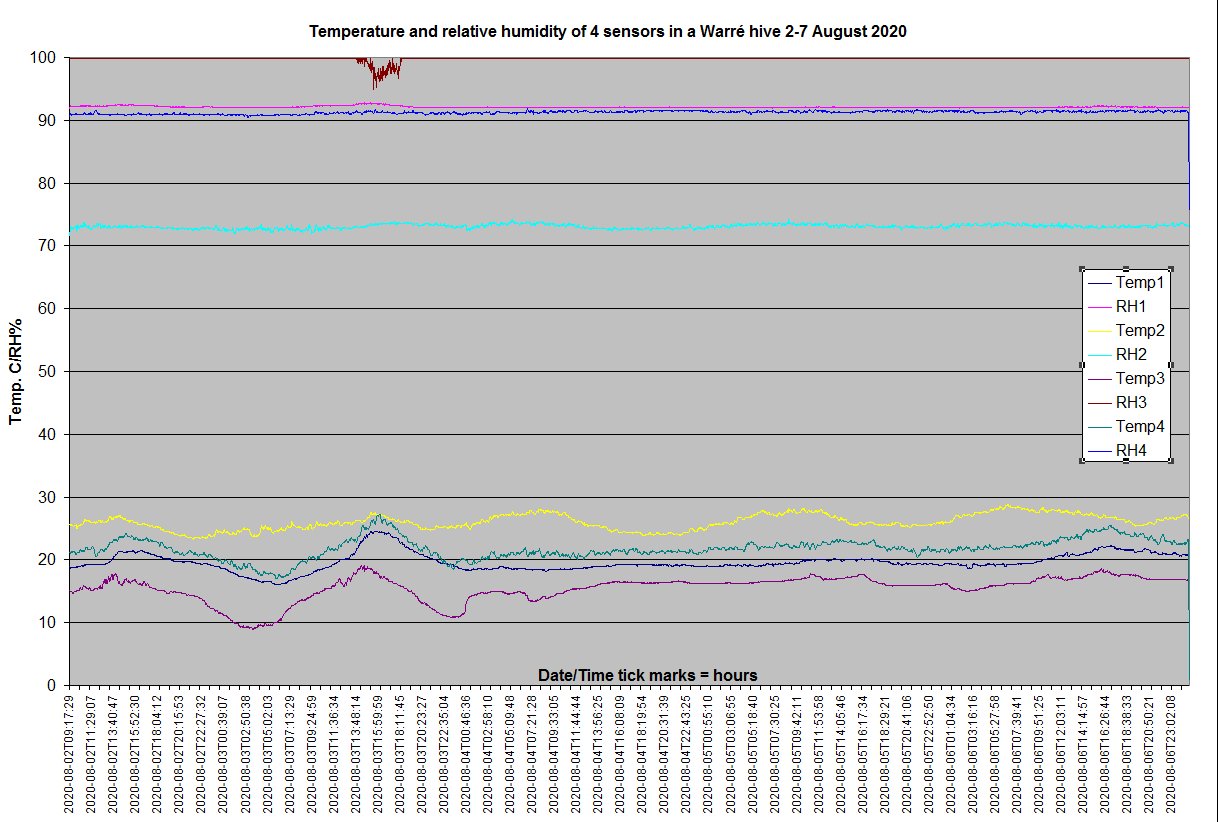
humidity_02-070820.jpg Battery failed mid week: one of the two 18650s not making contact.
References
1) J. Simpson (1950) Humidity in the Winter Cluster of a Colony of Honeybees, Bee World, 31:6, 41-44, http://dx.doi.org/10.1080/0005772X.1950.11094637
2) Eouzan I, Garnery L, Pinto MA, Delalande D, Neves CJ, Fabre F,et al.(2019) Hygroregulation, a key ability for eusocial insects: Native Western European honeybees as a case study. PLoSONE 14(2):e0200048.https://doi.org/10.1371/journal.pone.0200048 .
3) Sachs, R. & Tautz, J. (2017) How Bees (Apis Mellifera) Reduce Humidity in the Beehive by Means of Active Ventilation. https://www.researchgate.net/publication/315083892 .
Contact: david (at) dheaf (dot) plus (dot) com